This lesson has two gears. Core = what you MUST know to start today. Mastery = the deeper "why" for when you're ready to level up. Beginners: do Core first, come back for Mastery later.
Why this matters
New traders try to memorize 40 candle names. Pros read one thing: who won the fight, and how badly.
Fluxus: "Technical analysis, to me, is sentiment analysis. Connect the emotion to the data and the rest follows."
Fluxus: "Structure decides everything. Price is just the result of the fight; structure is the shape of the war."
A candlestick is not a shape to name. It is a photograph of a battle over a fixed slice of time. Every candle covers one time slice — on a daily chart one candle = one day; on a 1-hour chart one candle = one hour, and the same logic works on any timeframe. Buyers push up, sellers push down, and when the bell rings the candle records who was left standing. Read that photo honestly and you never need a pattern name again.
New-reader gloss bulls = buyers pushing price up. bears = sellers pushing price down. green candle = close > open (up). red candle = close < open (down).
Core Mode
Everyone starts here
L1.1A candle answers two questions
Every candle answers two questions. That's the whole subject.
Where did price close inside the candle's full range?
- Close near the top → buyers were in control when the bell rang → bulls won.
- Close near the bottom → sellers were in control → bears won.
- Close in the middle → neither side finished on top → a draw.
The body (open→close) is the winner's territory; a wick is ground someone grabbed and then lost.
- Big body, tiny wicks → one side dominated → high conviction.
- Small body, long wicks → both fought, nobody closed it → indecision.
- Long lower wick → bears drove down, bulls slammed it back up → a rejected attack by bears.
- Long upper wick → bulls drove up, bears crushed it back down → a rejected attack by bulls.
Body = how hard. Close = who. Wick = a rejected attack. Everything else is noise.
Fluxus: "Entries are opinion. Structure is fact. Volume is truth."
A strong close is a promise about tomorrow — the single most important idea in this course. It gets its own section: L1.6, where we also measure it.
One trap to kill now
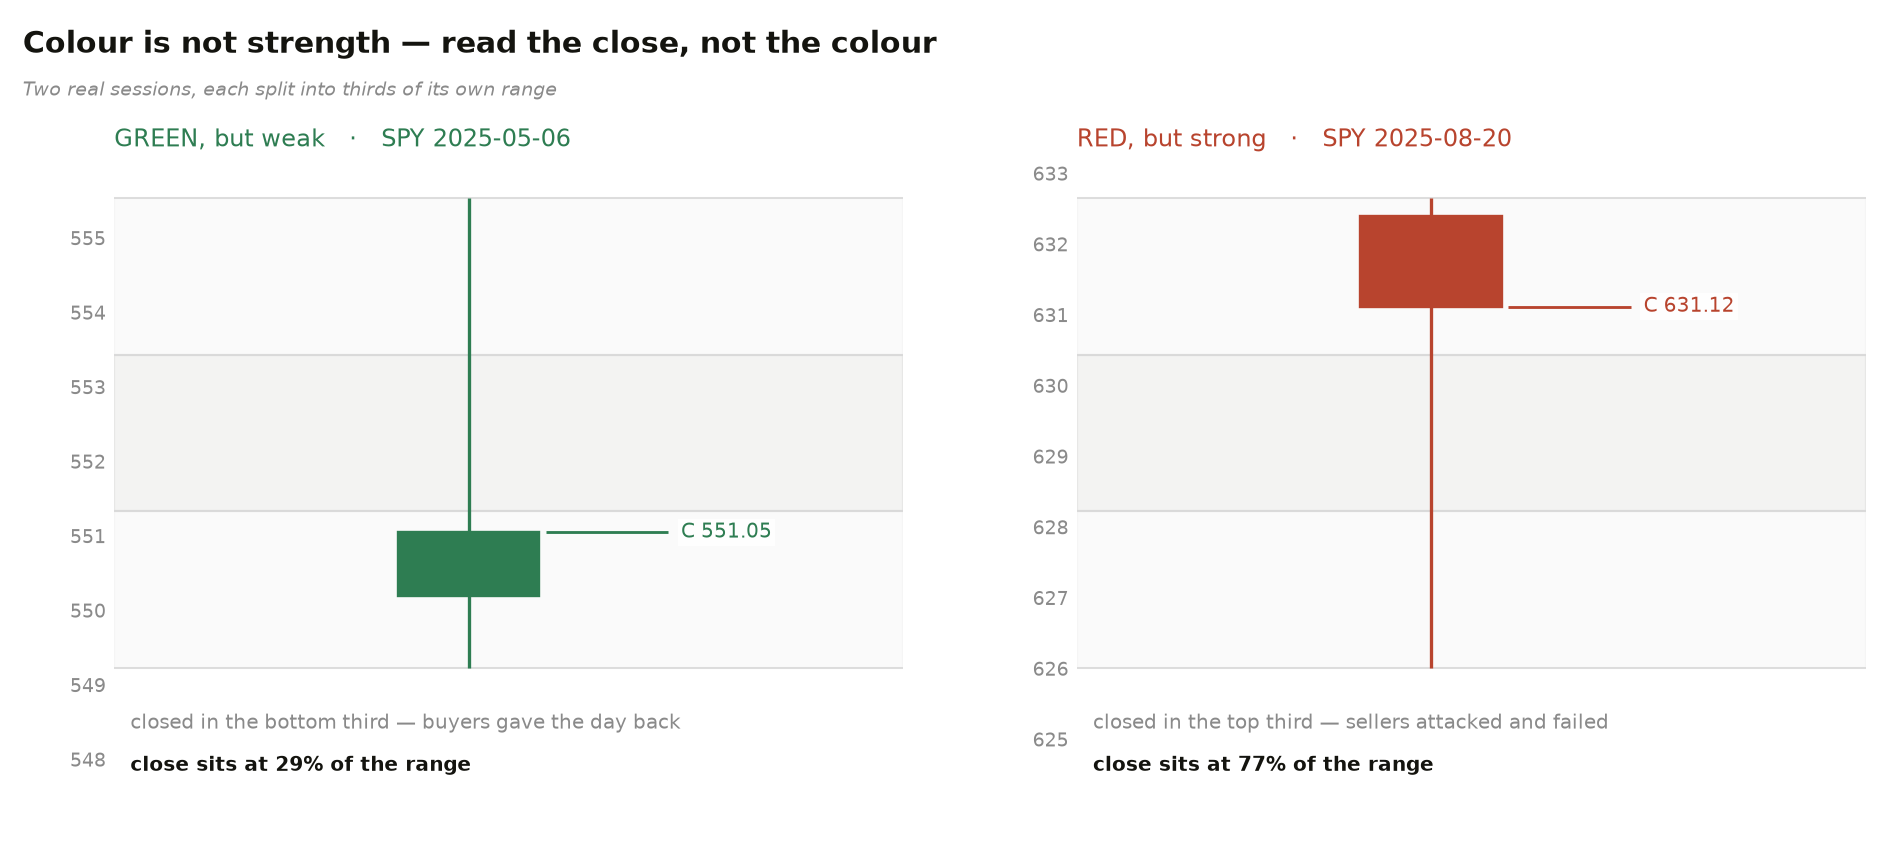
Color ≠ strength. A green candle that closes in its lower third is weak, even though it's "up." Read the close location, not just the color.
Why Close is king
Each candle is one boxing round. Highs and lows are punches thrown, but the judge records only who was standing at the bell — the Close. The Open says where the fight started; the Close says who won. Close carries far more weight than Open.
Deeper lens — it's a game, not a single result. Don't picture one winner and stop. Picture a continuous auction: every tick, buyers and sellers negotiate, and the Close is only where they temporarily agreed when the bell rang. So don't just ask "who won?" — ask "who is pressing, who is absorbing, and is the balance of power shifting?" A candle is one frame of an ongoing tug-of-war.
L1.2The Core Drill
You don't learn this — you drill it until it's reflex, like a boxer on the bag.
Naked Read-Aloud Drill
- Open any daily chart. Remove every indicator.
- Point at one candle. Say out loud, one breath: "Buyers won, hard." / "Sellers won, weak." / "Draw — bulls attacked and failed."
- Start at 20 candles a day, work up to 50 — for 5 days. No skipping the days. If you hesitate >2 sec on a candle, you don't know it yet.
The goal isn't predicting the future — it's reading the present candle so fast you stop thinking about it.
Mastery Mode
Come back when Core is reflex
L1.3Rebuild the candle from four numbers
Indicators are opinions about price. Price is the fact — and its smallest unit is one candle, built from exactly four prices in one time slice:
| Meaning | |
|---|---|
| Open (O) | where the round started |
| High (H) | furthest bulls pushed |
| Low (L) | furthest bears pushed |
| Close (C) | price at the bell |
O→C draws the body; H & L draw the wicks. That's the whole construction.
Precision: thirds of the range
Divide the candle into thirds. Close in the top third = bulls control the finish; bottom third = bears; middle = still contested. This upgrades the Core's "top/bottom" into a measurable read.
L1.4A minimal vocabulary — keep 4, not 40
You are not memorizing names; you are filing a reading you already derived. The name is just a tab.
| Shape | What you see | The reading |
|---|---|---|
| 1. Wide body | big body, tiny wicks | one side dominated |
| 2. Doji / spinning top | tiny body, wicks both sides | true indecision |
| 3. Hammer | small body, one long lower wick | a rejected sell attack (demand showed up) |
| 4. Shooting star | small body, one long upper wick | a rejected buy attack (supply showed up) |
Four shapes. Each is just a label for a reading you already derived from Body + Close + Wick.
Compression labels
| Label | What it is |
|---|---|
| VCP (Volatility Contraction Pattern) | Minervini's coil: each pullback shallower than the last, volume drying |
| Flag / Pennant | a short tight pause after a sharp move |
| Triangle | converging highs and lows |
| Inside-bar stack | multiple inside bars in a row (L2 → extreme) |
| NR7 / Bollinger squeeze | narrowest range in 7 bars / Bollinger Bands (a volatility envelope around a moving average) pinching — quant tells for compression / 7 |
All of these are the same idea wearing different clothes: a loading spring.
Shakeout labels
| Label | What it is |
|---|---|
| Undercut & Rally (URAR) | poke below a low, then reclaim — O'Neil |
| Shakeout | a sharp flush designed to scare weak hands out |
| Spring (Wyckoff) | a dip below support that springs back in |
| Bear trap | breakdown that reclaims, trapping shorts |
| Stop run / liquidity grab | price reaching for the resting stops |
Same idea in five costumes: flush the weak, then go.
L1.5This atom builds price structure
Individual candles stack, brick by brick, into the structure that this whole system reads first — before any indicator or news.
→ Structure first, everything else second: Lesson 3 and Lesson 10 are built entirely out of these bricks.
Deeper lens — the market breathes: one-sided ↔ two-sided. Price cycles between trending phases (one side dominates; big bodies stack in one direction) and ranging phases (balance; small bodies and long wicks, neither side can close its advantage). The same candle means different things in each phase — a long lower wick is a gift in an uptrend and a trap in a range. Reading which phase you're in is the seed of Lesson 3 (compression → expansion) and Lesson 6 (market cycle).
Why we start naked. Chinese trader-author Ling Bo describes six levels a chart reader climbs through: (1) beginner trading on feel; (2) after first losses, learning simple patterns; (3) pattern-obsessed but still losing; (4) stacking indicators on indicators; (5) returning to the naked candle — price and volume only; (6) reading the market at large. Most people spend years climbing from 1 to 5. This course simply starts you at level 5: that is why Module 1 gives you no indicator you are meant to trade from. The one place an indicator appears — the oscillator family in L5 — is there to show you why it cannot be a trigger, not to hand you one.
L1.6A candle is a promise
The moment a candle closes strong (big body, close in the top third), it makes a promise about tomorrow: more buyers should follow. Trading is the business of tracking that promise.
- Promise kept → continuation. The expected strength shows up. Stay with it.
- Promise broken → expectation failure. The strong candle is followed by weakness. This is the highest-information event in trading — the crowd was leaning one way and got caught.
So we measured it — 58,200 sessions, 20 US large caps, 2015-2026: after a strong close, the next session went the promised way less often than chance (51.0% against a 52.7% base rate), all four single-candle signals land at or below their base rates, and by forward return the bearish pair even inverts. A candle describes the session that just ended; it does not forecast the next one. The forecast comes from context — the market (L6), the template (L10), the setup (L11) — which is the rest of this course: read the promise to know what the crowd expects; trade the context that decides whether they get it.
You will not master this from one candle. Lesson 2 is built entirely on it: 2–3 candle combos of promise-kept (continuation) vs promise-broken (reversal), and what to DO when the promise breaks.
L1.7The Mastery Drill
Structured Journal Drill
- Strip indicators. For each candle state (1) who won (which third), (2) how hard (body), (3) any rejection (long wick? which side?).
- Write the read for 20 candles into a journal, then reveal volume (the number of shares traded during that candle — a measure of how many people participated): did big bodies come with big volume?
- Daily × 5 days, rotating stocks. Journaling forces honesty; saying it in your head lets you cheat.
Beginner Traps
1. Naming instead of reading. "That's a hammer!" — so what? If a name doesn't map to who / how hard / rejection, throw it away. 2. Reading a candle in a vacuum. A big green candle at a crash bottom ≠ the same candle after a 10-day run. Location changes meaning (Lesson 3). 3. Color = strength. (See Core.) Read the close location.
TL;DR
- Core: a candle is a photo of a fight — Close = who won, Body = how hard, Wick = a failed attack. Drill 50/day out loud.
- Mastery: it's really 4 numbers (O/H/L/C); Close is king; read thirds; keep 4 shapes as labels; this atom builds price structure.
Extended Reading (optional)
Not required. Skip until Core is reflex — you can safely ignore this for weeks. There are other chart types (line chart, Renko, Heikin-Ashi, Footprint / order-flow) that show the same buyer-vs-seller fight through different lenses. You don't need any of them yet. Just remember: the candle is a model of the fight, not the fight itself.