This lesson has two gears. Core = what you MUST know to start today. Mastery = the deeper "why" for when you're ready. Beginners: do Core first.
Why this matters
Every swing runs the same wave: from the point where everyone who wanted to sell has sold, to the point where everyone who wanted to buy has bought.
Fluxus: "The top, at its core, is when no new buyers walk in. That's the whole definition."
Fluxus: "The market's job is to squeeze everyone from one extreme to the other."
Fluxus: "Price just went back a few months. Sentiment doesn't make round trips."
Module 1 note: This closes the eye-training module. You are learning to see the whole wave on a naked chart. No real trades yet. Real entries, stops, and sizing arrive in Module 2. For now: recognize, drill, repeat.
Lessons 1–4 zoomed into single candles, combos, coils, and shakeouts. Now zoom out. Stack those pieces together and they form one repeating emotional wave: oversold → turn → markup → overbought → turn. Your job as a swing trader is simple to say and hard to do — get in near the bottom of the wave (seller exhaustion) and get out near the top (buyer exhaustion). This lesson is the bridge from single bars to the market cycle you'll live in for the rest of the course.
Core Mode
Everyone starts here
L5.1The full cycle, oversold to overbought
Oversold and overbought are about EXHAUSTION, not price level.
- Oversold = sellers are exhausted. Everyone scared has already sold. Not "cheap" — spent.
- Overbought = buyers are exhausted. Everyone eager has already bought. Not "expensive" — spent.
The full cycle has four stages:
- Capitulation — the oversold low; max fear; the shakeout (Lesson 4) lives here.
- The turn — the reclaim; sellers gone, buyers step in.
- Markup — the trend; the meat of the move.
- Climax — the overbought top; max greed; parabolic exhaustion.
You enter at stage 2 (the turn), ride stage 3, and exit into stage 4. You never buy stage 1, and you never short (i.e., bet on falling prices; see gloss below) during stage 3 prematurely.
One trap to kill now
"Oversold" is a CONDITION, not a BUY button. A market can stay oversold and keep falling for weeks. (One popular gauge, RSI / Relative Strength Index, is a 0–100 needle that measures how stretched price is; an RSI at 20 can go to 10 — deeply oversold and still falling. Details in Extended Reading.) Oversold tells you the wave is stretched; it does not tell you to buy now. You still wait for the turn (the reclaim from Lesson 4). Same in reverse at the top.
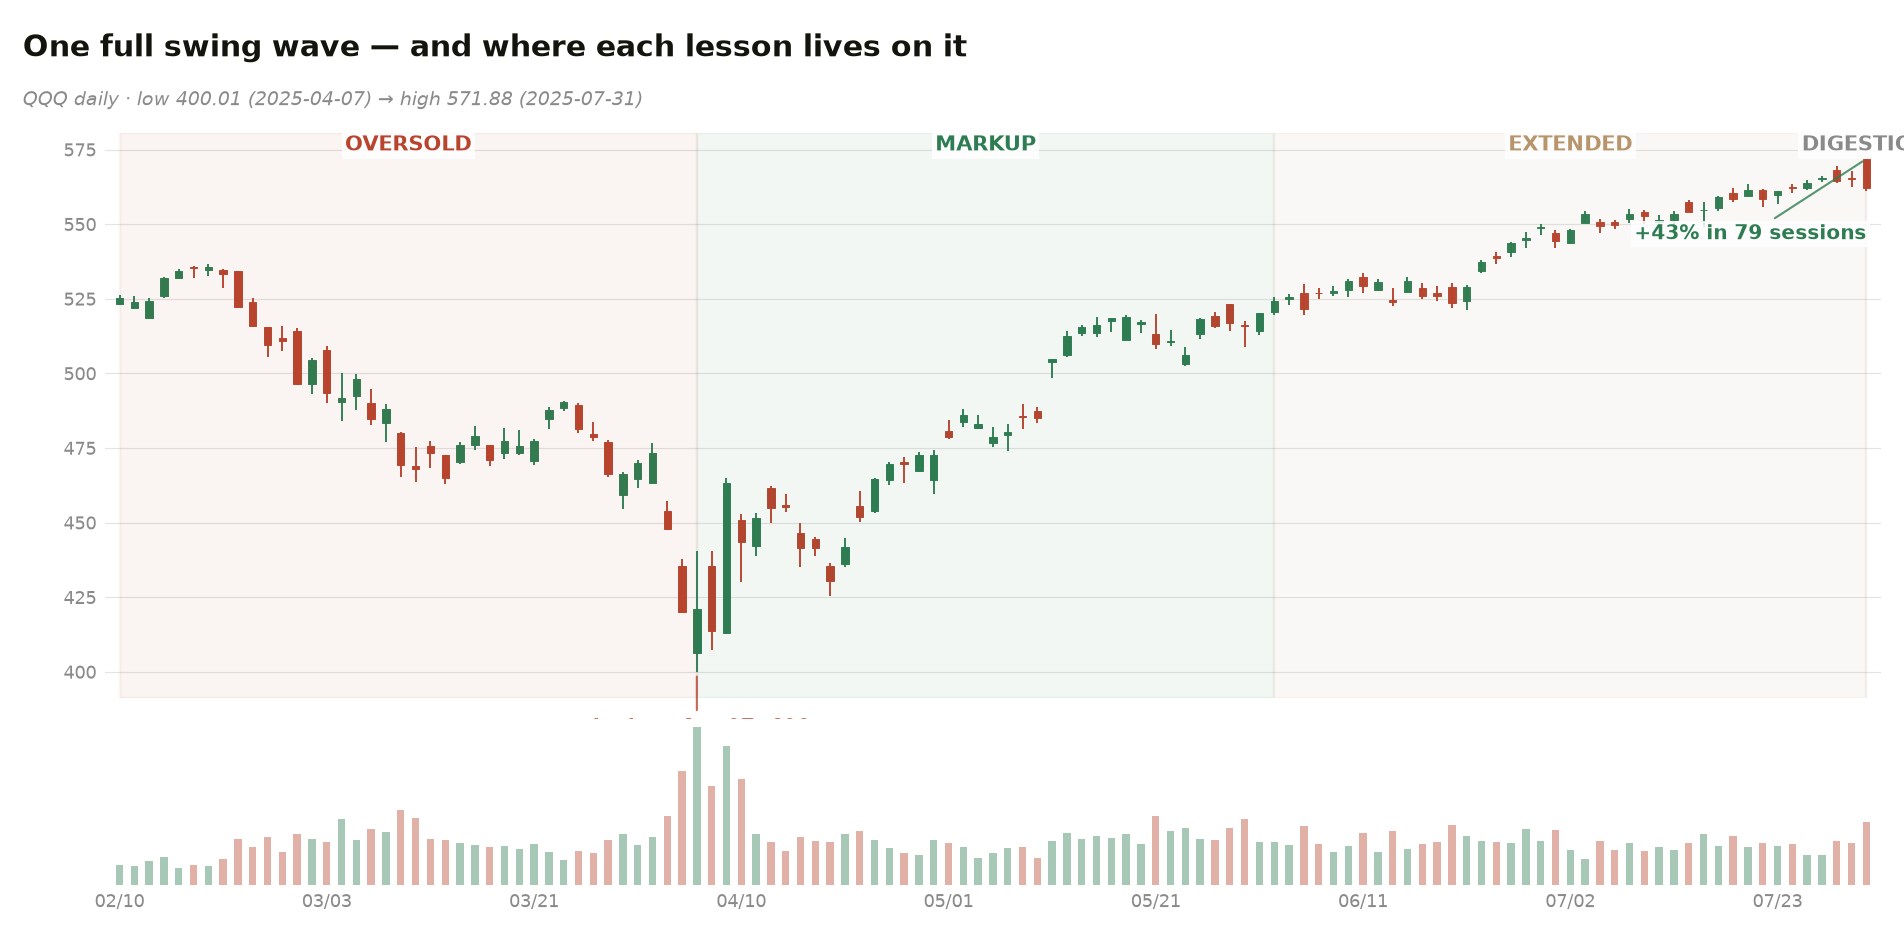
And one law that closes the loop: every overbought has a matching oversold. A cycle is sealed by a pair of exhaustions. If you cannot find the opposite extreme on the SAME timeframe, the cycle is not finished — or you are reading the wrong timeframe.
L5.2The anatomy of a bottom — three kinds
Every bottom must do two jobs: absorb the remaining supply, and then PROVE demand. The proof is always the same — a close back above the structure. What differs is how the absorption looks, and that gives you three shapes worth naming:
①· Panic → base → proof
A capitulation gap or down kill bar dumps the supply all at once; price goes quiet and sideways while the last sellers finish (L3's compression, at a low); then the reclaim. The candle to watch inside the base: hammers and down-wicks — attacks that keep failing (L1).
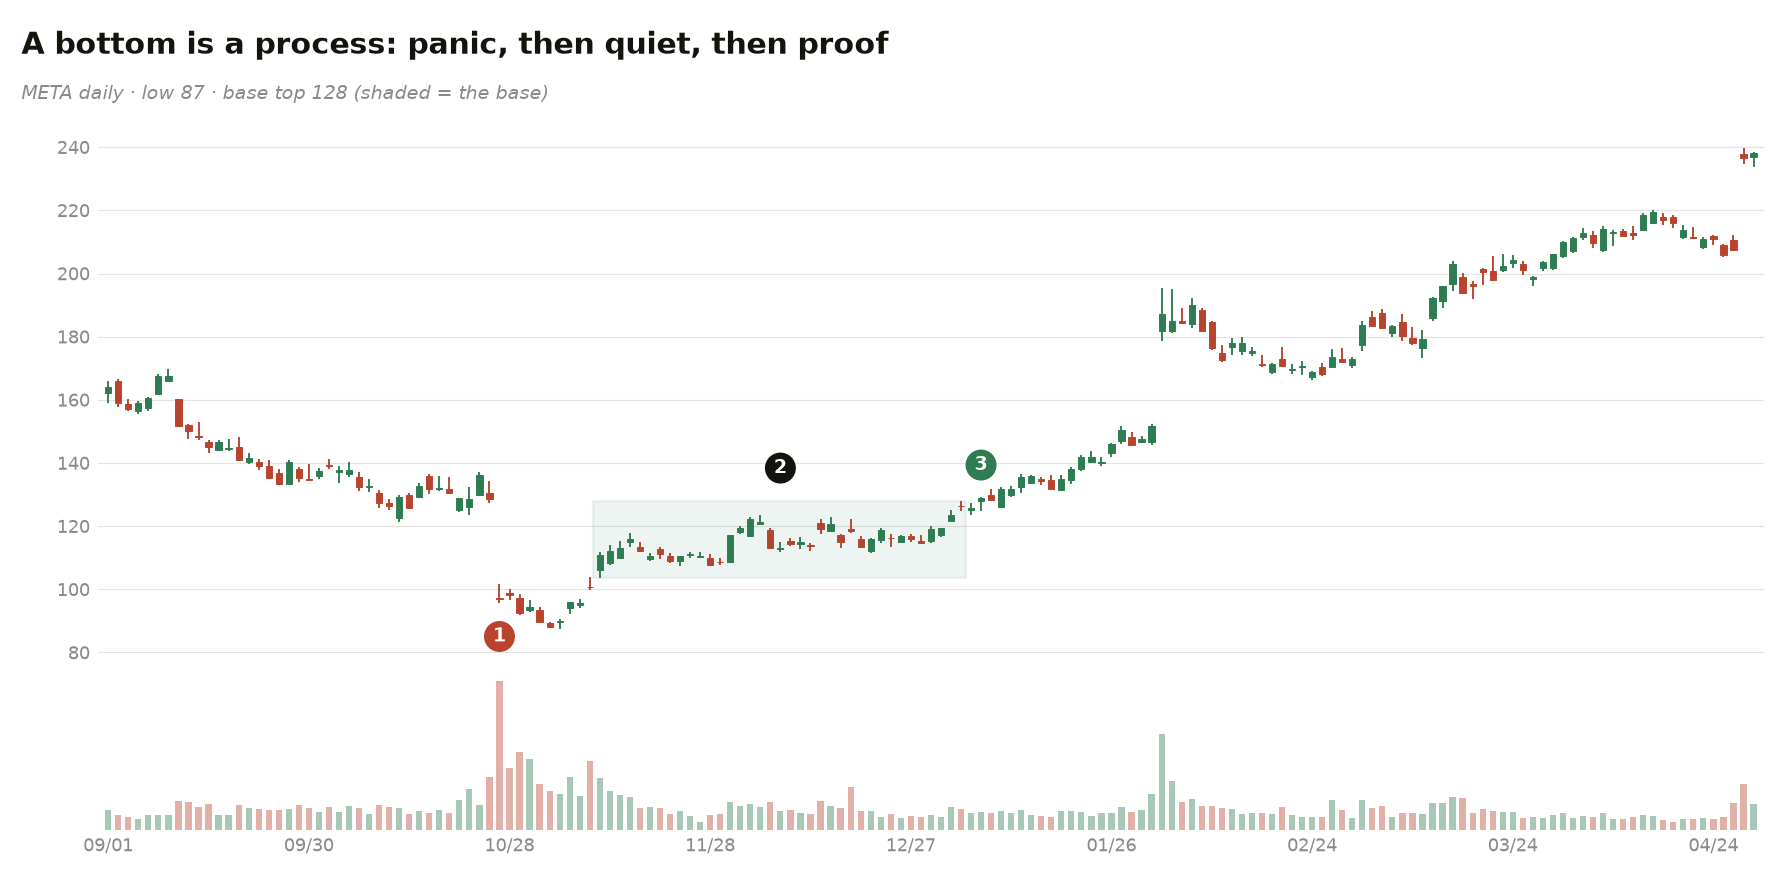
① capitulation on a gap · ② the base — supply running out · ③ the turn: reclaim of the base top
The special case: the V-bottom. When the panic is violent enough, step ② barely exists — the capitulation IS the bottom, and price leaves without building a base. You have already seen one: SPY, April 2025 (L4.6) — swept 12% below the level, reclaimed within days, never looked back. Fluxus compresses the whole asymmetry into one line:
Fluxus: "Bottoms are events. Tops are processes."
A bottom can finish in one violent session; a top almost never does — three of the four shapes in L5.3 take weeks; the exception, the parabolic top, is L12's territory. The practical asymmetry: at a suspected bottom you must be ready fast; at a suspected top, you have time.
②W · The test that holds
The first low prints in fear; weeks later price comes back down to it — and stops short or holds level. That second test failing to make a new low IS the information: whoever wanted out at that price already got out. Trigger: the neckline (the bounce high between the two lows).
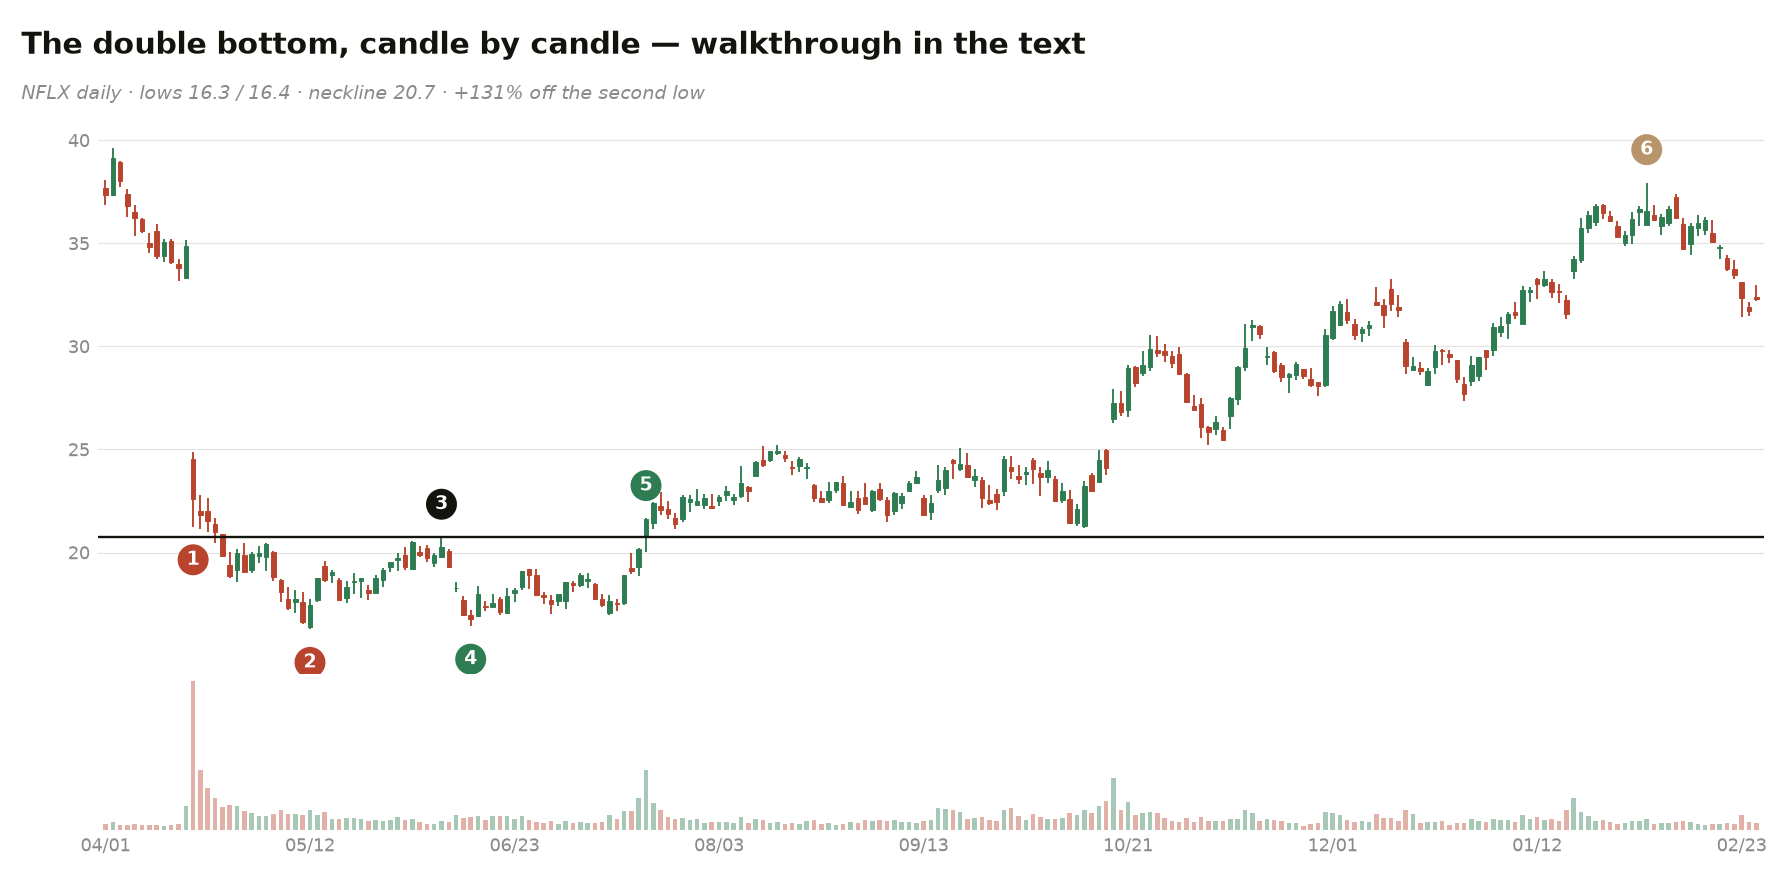
① Apr 20: the earnings gap — a kill bar (L2.5); the old story dies on the spot · ② the first low, printed in fear · ③ the bounce high between the lows — this becomes the neckline · ④ the second test holds above the first low: whoever wanted out is out (L3's quiet, at a low) · ⑤ the close above the neckline — the only trigger · ⑥ what proof was worth
③· The rounded repair
After a true crash there is no V and no clean W — just months of sideways while ownership changes hands completely. Time is the absorption. The trigger is unchanged: the base top goes.
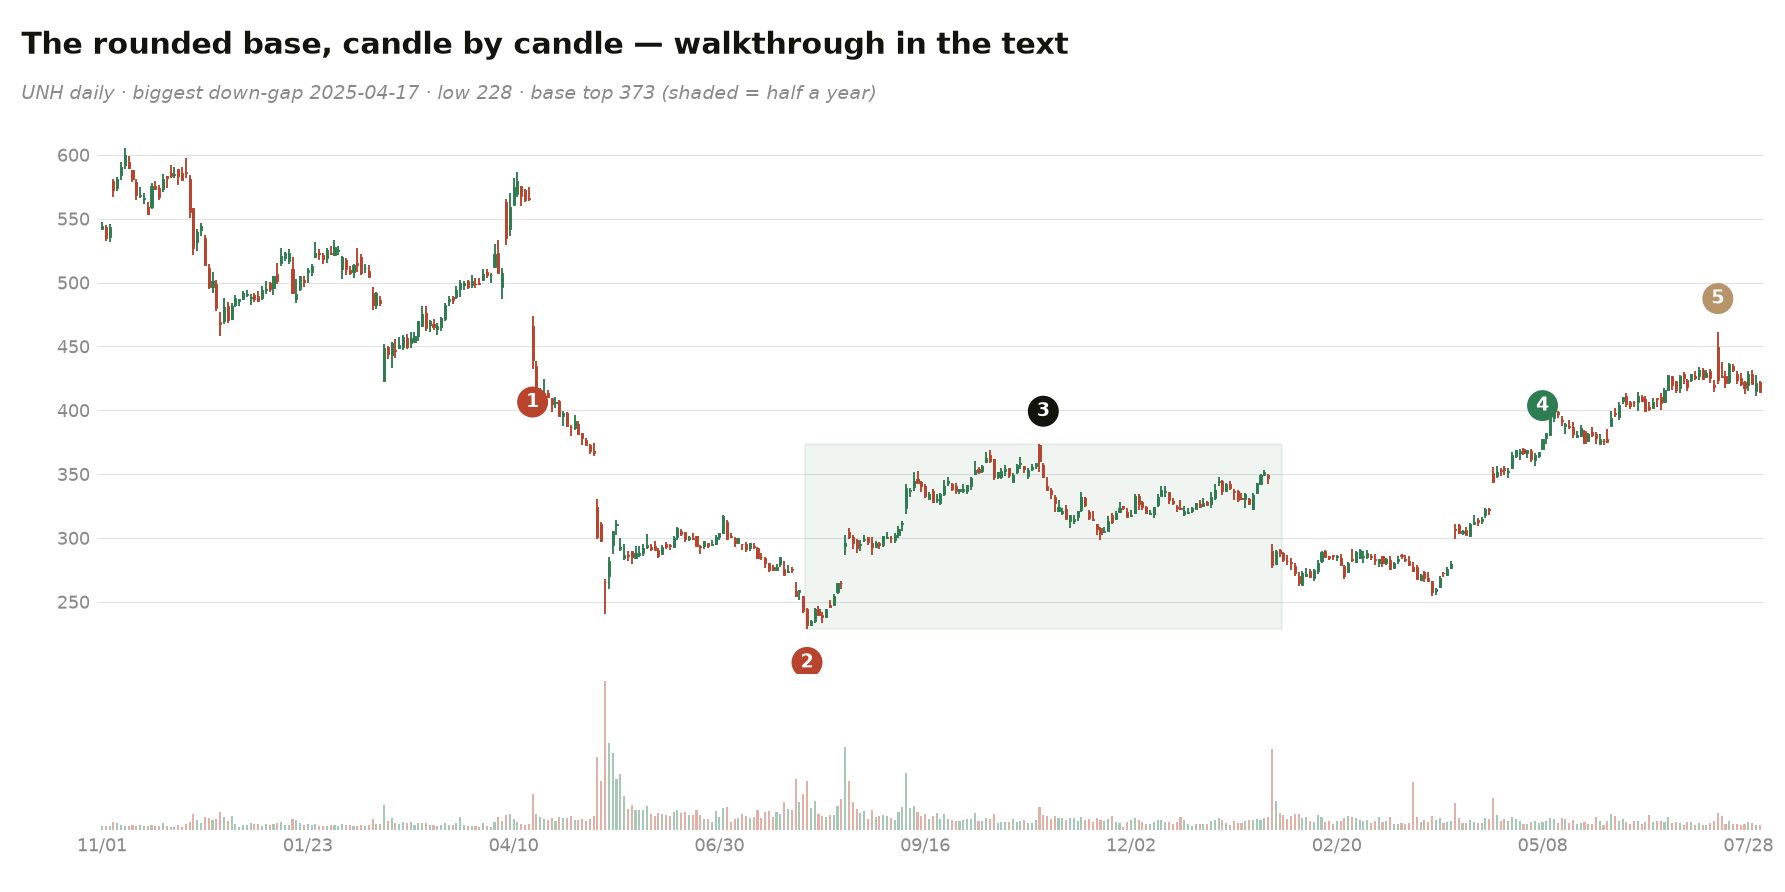
① Apr 17: the biggest down-gap of the decline — panic accelerating, not ending · ② Aug 1: the actual low, months later — a crash this size does not end on one gap · ③ half a year inside the shaded base: time is the absorption · ④ the first close above the base top — same trigger as every bottom · ⑤ the repair, a year after the panic
L5.3The anatomy of a top — four kinds
Tops are bottoms in a mirror, with one twist: the loudest moment comes BEFORE the highest price. Supply doesn't panic in; demand quietly runs out. Four shapes:
Vertical acceleration, then the biggest volume of the whole move — the crowd's last scream — then price grinds slightly higher ON LESS: the divergence. The first break of a pause low completes it. Sell into the strength of ②③, not the weakness of ④ (L14B).
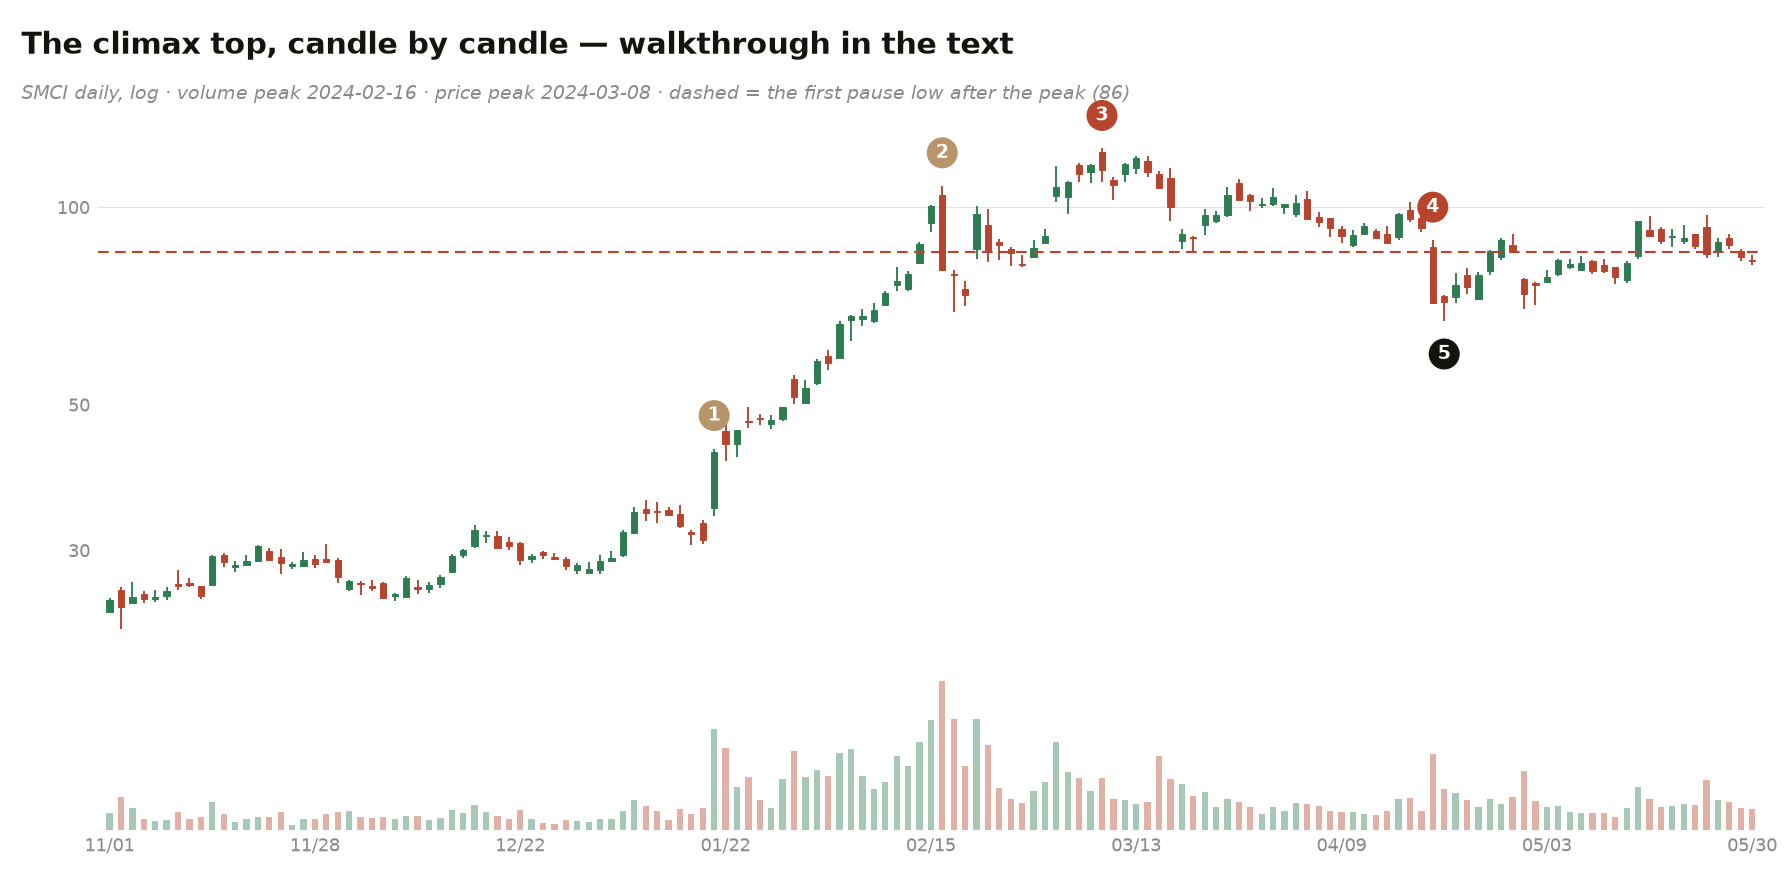
① Jan 19: the acceleration bar — a breakaway bar (L2.5) that turns the trend vertical · ② Feb 16: sky volume, the biggest of the whole move — the crowd's last full-throated scream (and it closed down 20% on the day: the fight got violent) · ③ Mar 8: sky price on LESS volume — the divergence, and the day itself is an upper-wick reversal bar (L1's failed attack) · ④ the first pause low after the peak gives way (dashed) — structure breaks, the top is complete · ⑤ −45%
②· The retest that stops short
The mirror of the W: price returns to the high and CANNOT print a new one. Buyers thinned out exactly where they were loudest.
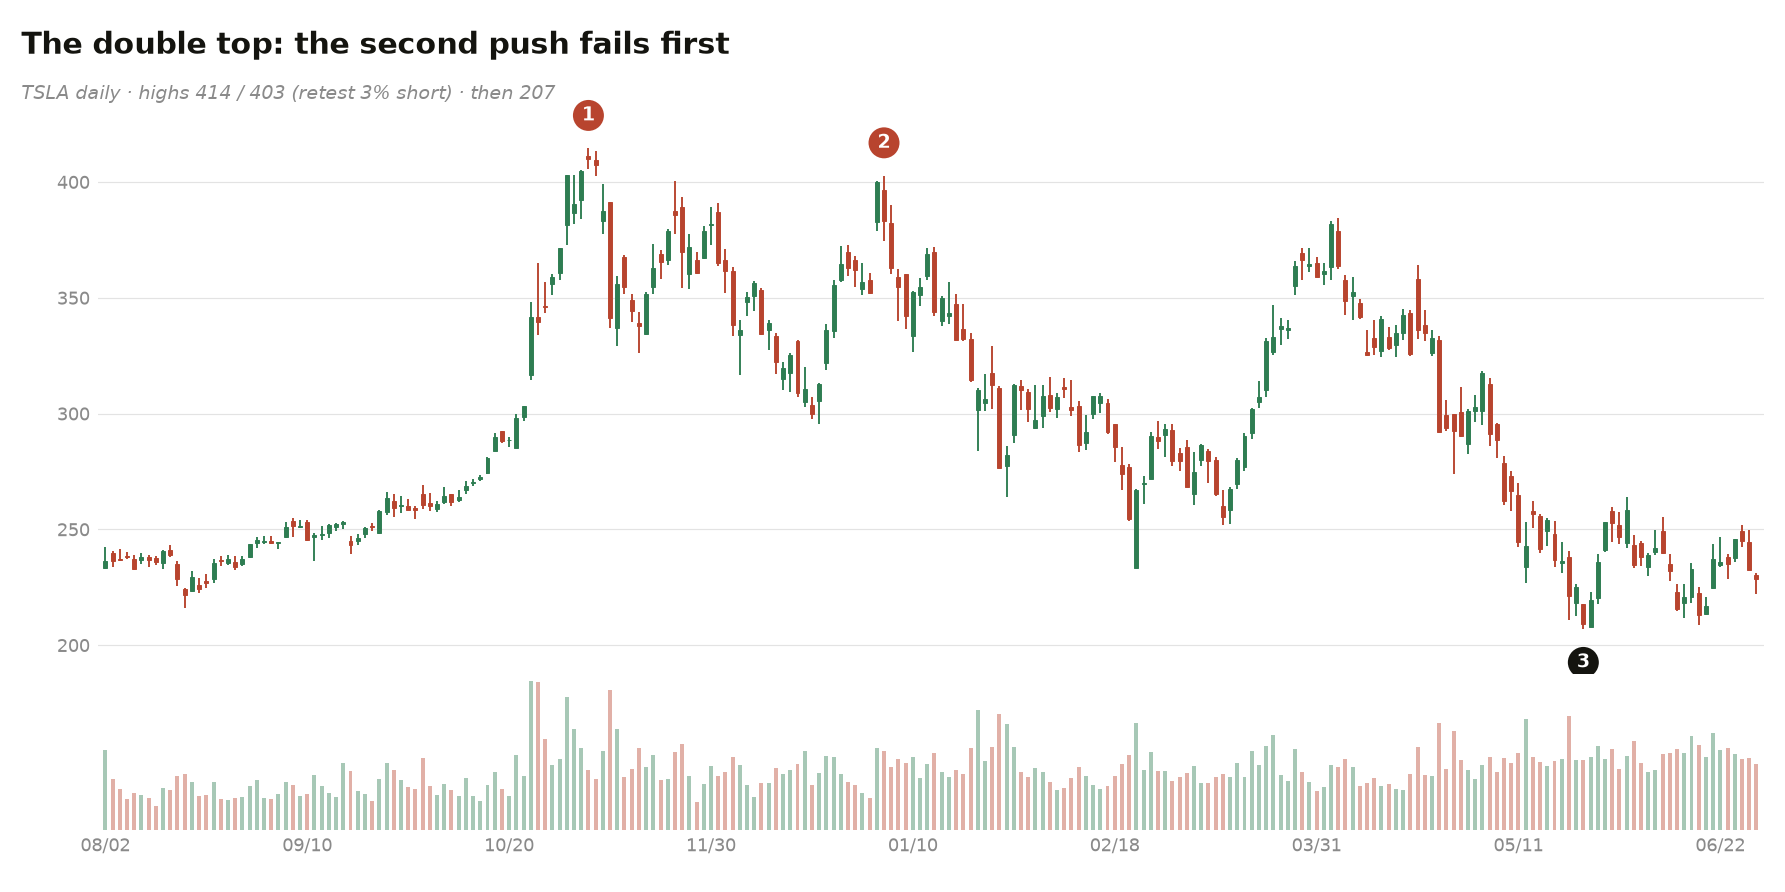
① the high · ② the retest stops 3% short — buyers thinner · ③ minus half
③· Shrinking pushes
Three or more pushes to new highs, each buying less ground than the last, with hard shakes between them: big holders are handing out inventory into every rally. Then the lower high, then the structure breaks.
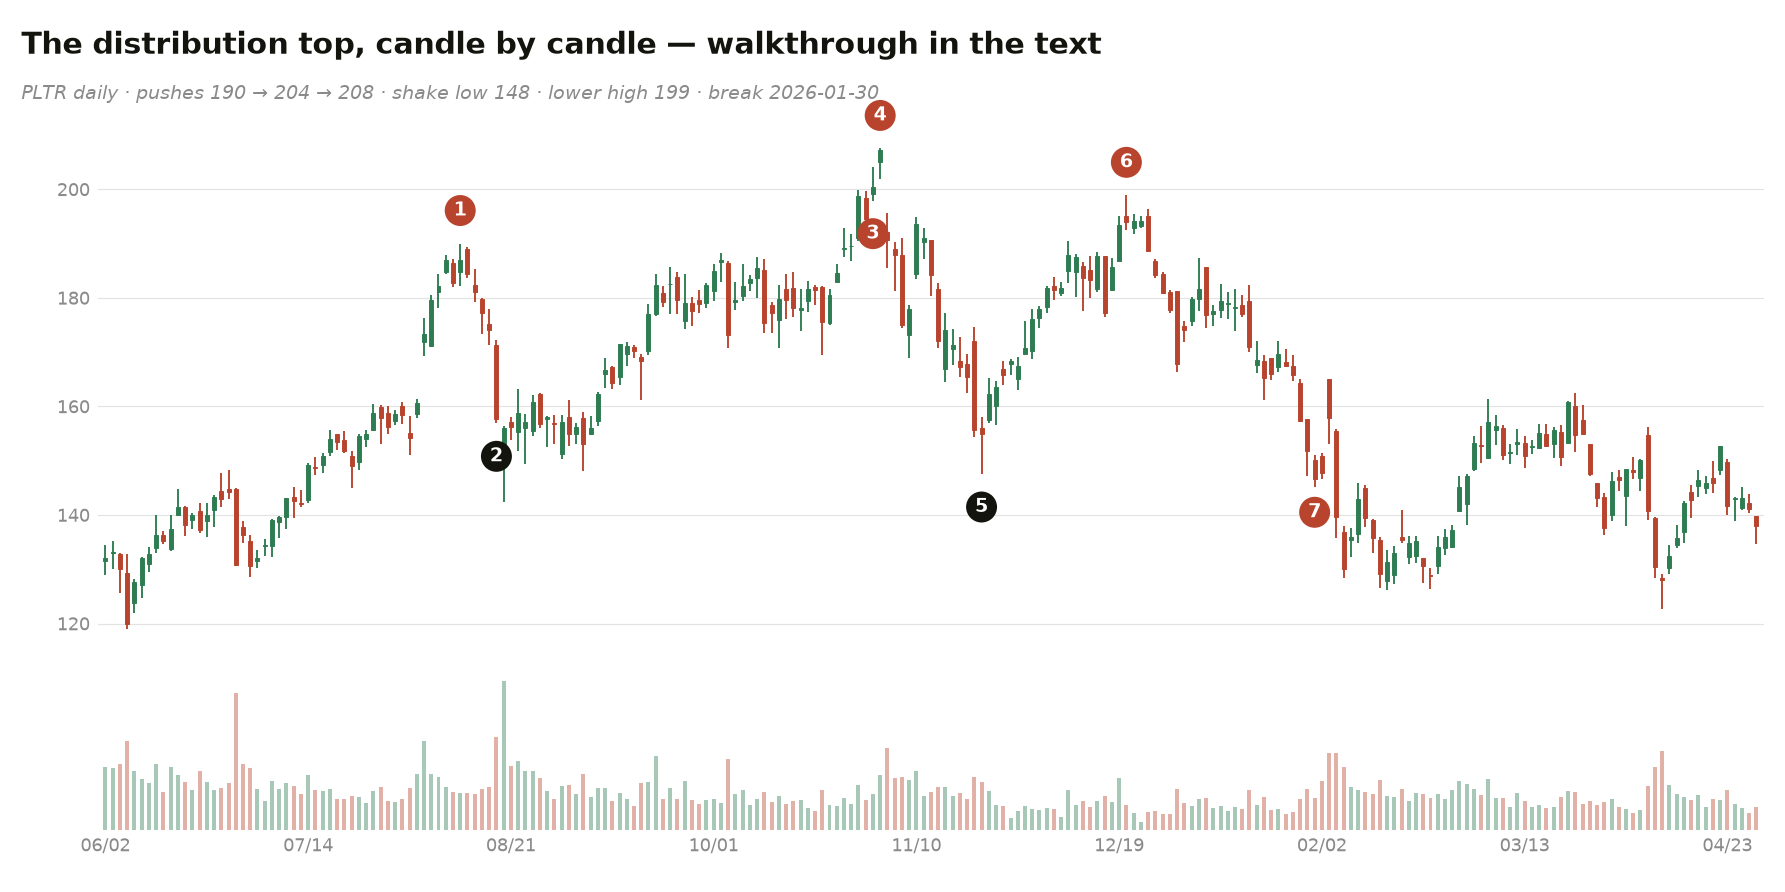
Reading the numbers on the chart — this one top uses half the course:
- ① The first push, 190 (Aug 12).
- ② Aug 19: an −8% bar on double volume — a kill bar (L2.5). It ends push one on the spot.
- ③④ Pushes two and three, 204 and 208 — ground gained shrinks from +14 to +4: the footprint of distribution.
- ⑤ The November shake to 148. Same shape as L4's shakeout — wrong address: it prints after three shrinking pushes, not inside a healthy trend. Same combo, different phase (L2.7).
- ⑥ The bounce stops at a lower high — buyers thinned exactly where they were loudest (L1's read, at swing scale).
- ⑦ Jan 30: the close below 148. Structure breaks, the top is complete — and "no reclaim, no trade" (L4) now works in reverse: no reclaim, no bottom.
④· Sky volume and sky price, one candle
A.k.a. the Christmas-tree top, or the supernova. It is the climax top with the divergence cut out: price goes vertical from its last pivot, and sky volume and sky price land on the same candle — a reversal bar that closes near its low. There is no quieter second high to wait for. Whether a run counts as parabolic is measured, not eyeballed, and shorting one is a separate trade: both live in L12.
Fluxus: "Index tops are usually not parabolic tops; individual stocks — momentum stocks above all — very often are. The difference is the controlled stock: how much its big holders need to distribute, and how much control they have."
A controlled stock is read from three numbers: institutional ownership, float, short interest.
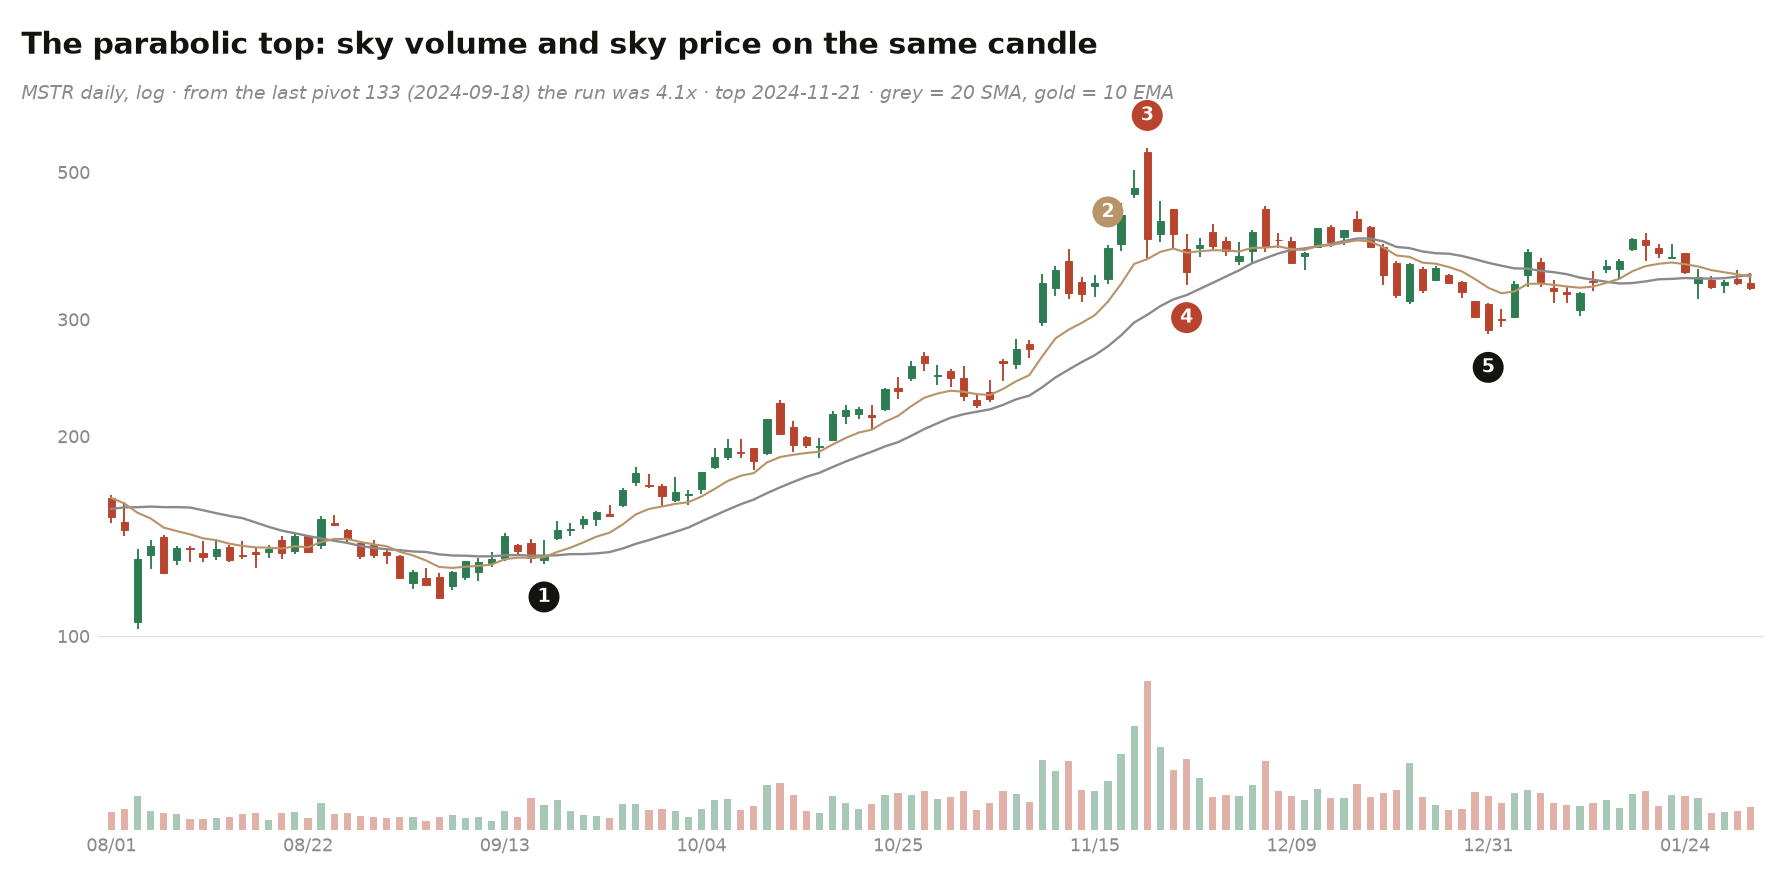
① Sep 18: the last pivot — the last touch of the 20 SMA, close 133 · ② Nov 18–20: three straight closes up 10% or more; the third closes 60% above the 20 SMA · ③ Nov 21: sky volume and sky price on one candle — volume 4.7x, high 543, close 397: −27% off the high inside one session. No divergence phase; the top is one bar · ④ Nov 26: the first close below the 10 EMA — the right side of the V (L12.2) · ⑤ Dec 31: −48% from the high
All seven cases, one grammar. Bottom or top, the market never announces the turn — it stops answering the old question. Your job is L1's: read who is exhausted, and wait for the close that proves it.
L5.4Fractal: the same dissection at every timeframe
Everything in this module was taught on daily bars. None of it is about daily bars. Markets are fractal: the same auction — press, absorb, exhaust, turn — plays out at every scale, because the players at every scale face the same problem. A daily candle IS a compressed hourly cycle (its four numbers are that cycle's open, extremes and verdict — L1.3 in reverse); a weekly base is a daily cycle seen from further away (CLS in L3 was twenty years of them). So the pairing law of L5.1, the seven shapes of this lesson, and every numbered dissection all re-run, unchanged, on weekly and hourly bars. The only thing that changes is whose money moves at that scale — and the proof is easiest to see by zooming into a chart you have already read:
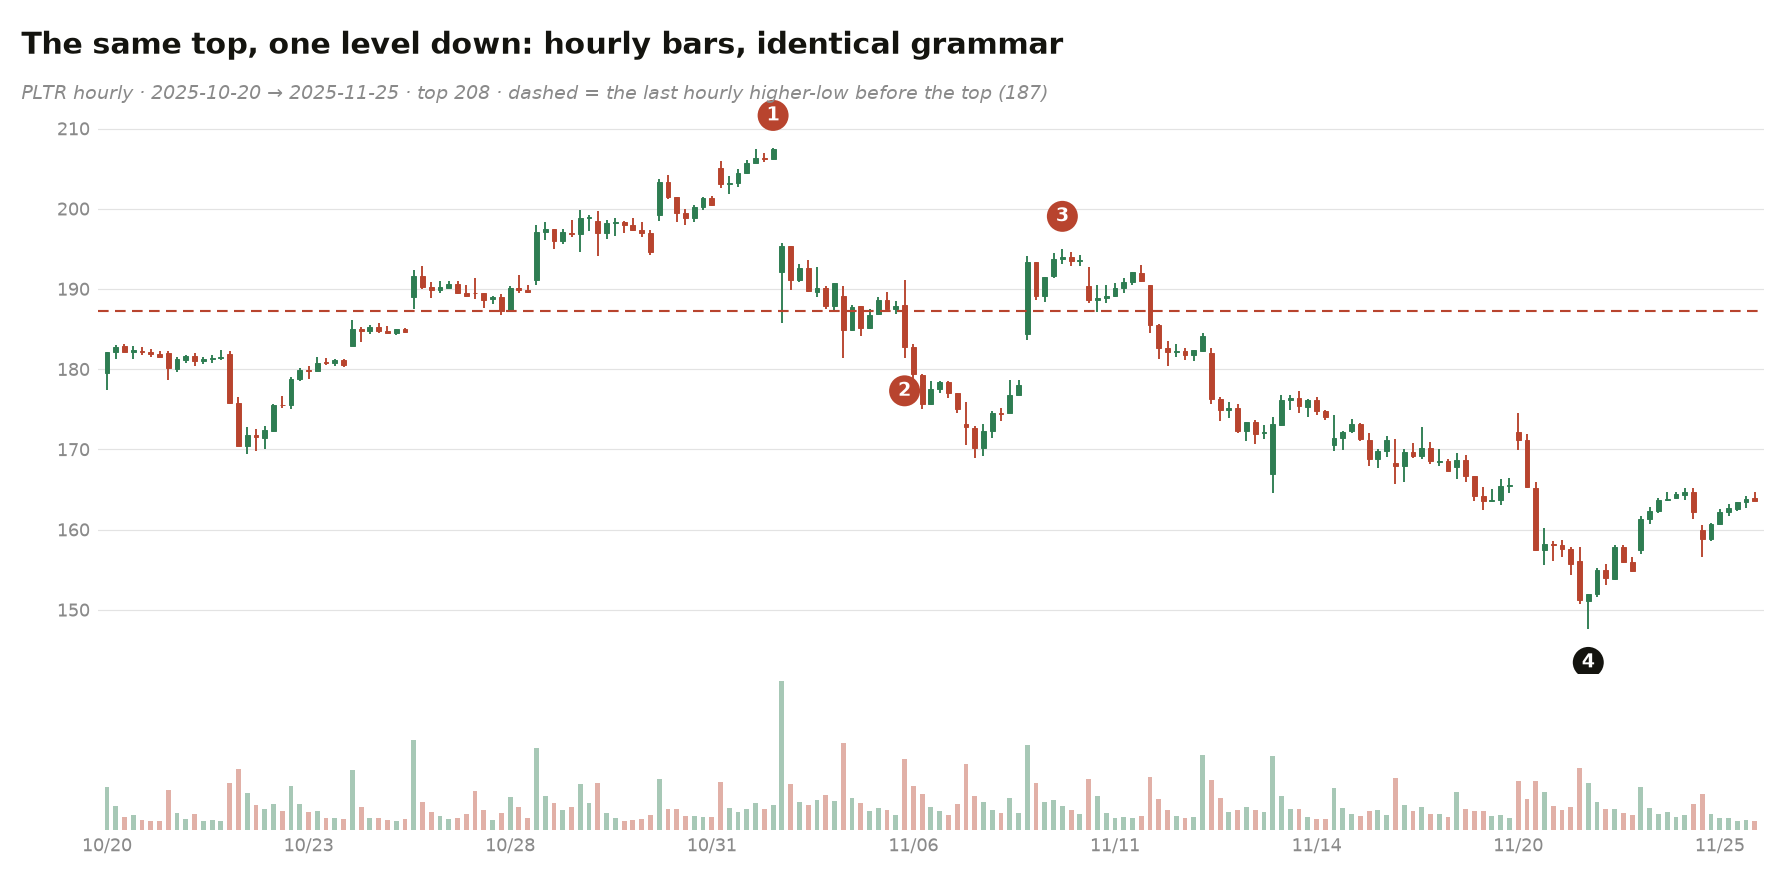
① the top, 208 — on hourly you can see the final push stall bar by bar · ② the kill hour — and it closes below the last hourly higher-low in the same candle: the kill and the break are one bar here, a week before the daily chart admits it · ③ the bounce stops at a lower high — the daily chart's circle ⑥, visible here as its own mini-cycle · ④ the slide
Use it in one direction: read your trading timeframe with the dissection, then drop one level to time the trigger. The shapes are the same; the tuition is cheaper one level down.
The full eight-month rehearsal — every tool in this module, one stock — is Module 1's appendix: MU 2026.
Beginner Traps
1. Treating oversold as a buy button. Oversold means sellers are spent — it says nothing about when buyers arrive. Wait for step ③. 2. Calling a bounce a turn. No reclaim of the base top, no turn — a bounce inside the base is noise. 3. Selling the panic, buying the euphoria. The anatomy says to do the exact opposite, and it feels wrong both times.
TL;DR
- Core: a cycle is sealed by a pair of exhaustions — oversold = sellers spent, overbought = buyers spent; no matching extreme on the same timeframe = the cycle is not done. Enter the turn, exit into the climax.
- Mastery: a bottom is panic → quiet → proof; a top is sky volume before sky price (the divergence), then the break of structure — except the parabolic top, where both land on one candle.