One stock, eight months, every piece of grammar this module taught — in the order the market chose to teach it. Each chart is one month of daily bars (the first four bars are the prior month's close, for continuity). Read the circles first, then the keyed lines. Nothing here is curated: this is simply what MU did in 2026, dissected with the tools you now have.
The full dissection (spoils the replay)
January
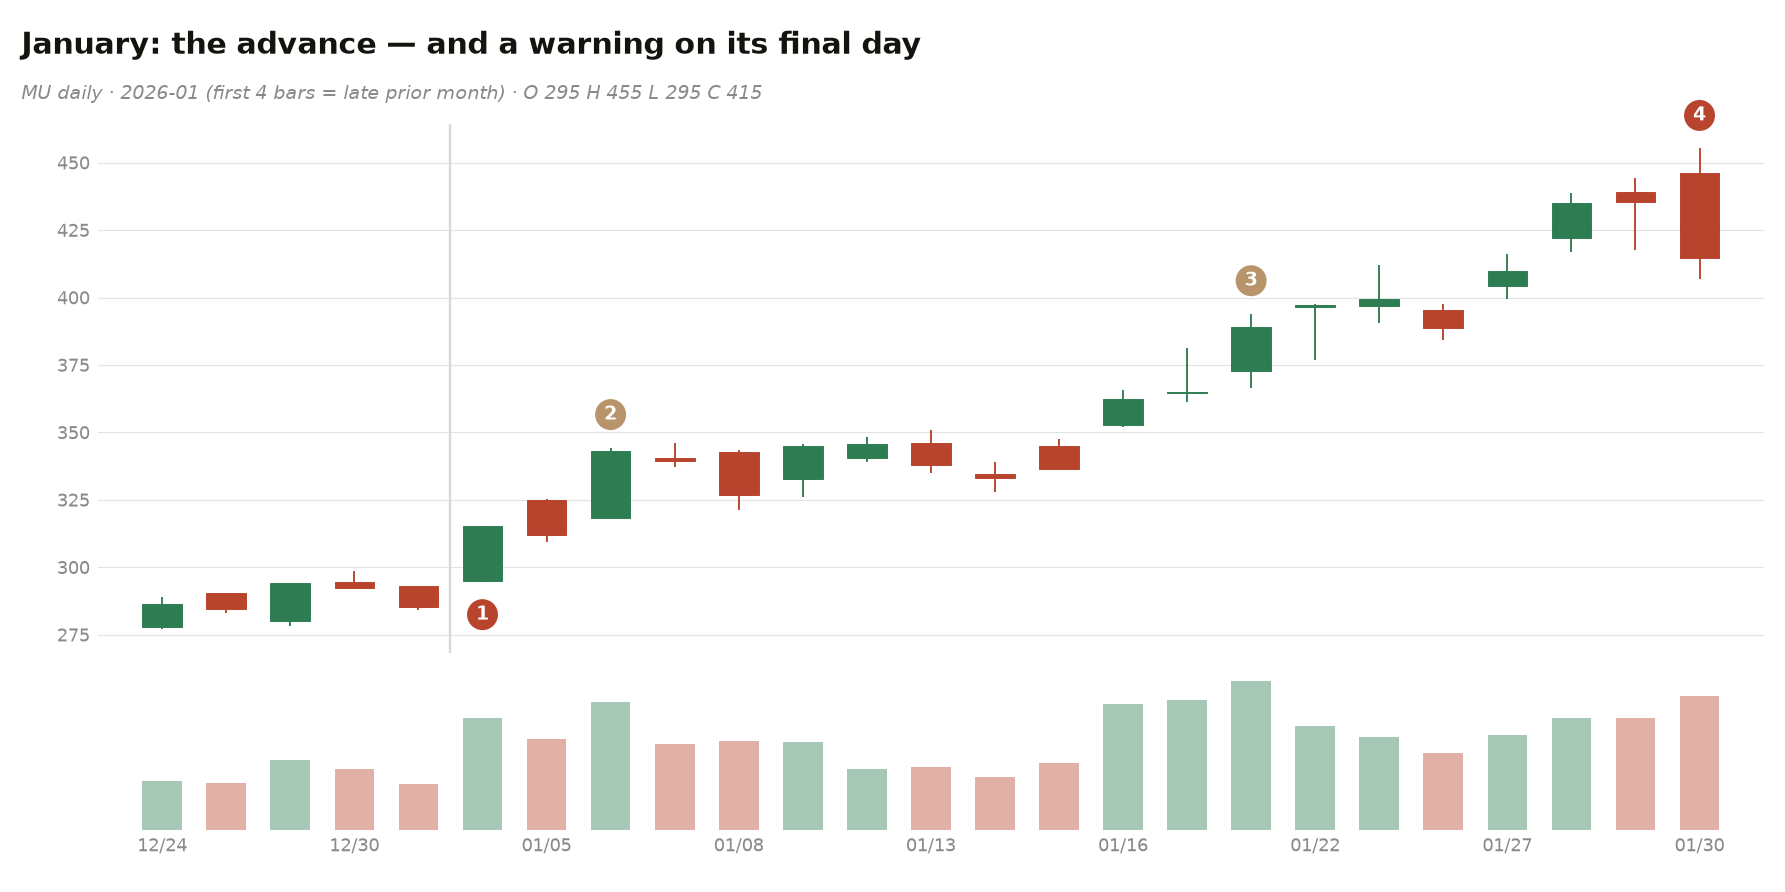
① Jan 2: the launch low, 295
② Jan 6: the acceleration bar, +7.9% — a breakaway bar (L2.5)
③ Jan 21: volume expands WITH the trend — confirmation, not warning (L3's fuel gauge)
④ Jan 30: the month's high, 455 — and its biggest down bar, the same day: an upper-wick reversal printed at the top (L1's failed attack). The advance ends with a warning shot.
February
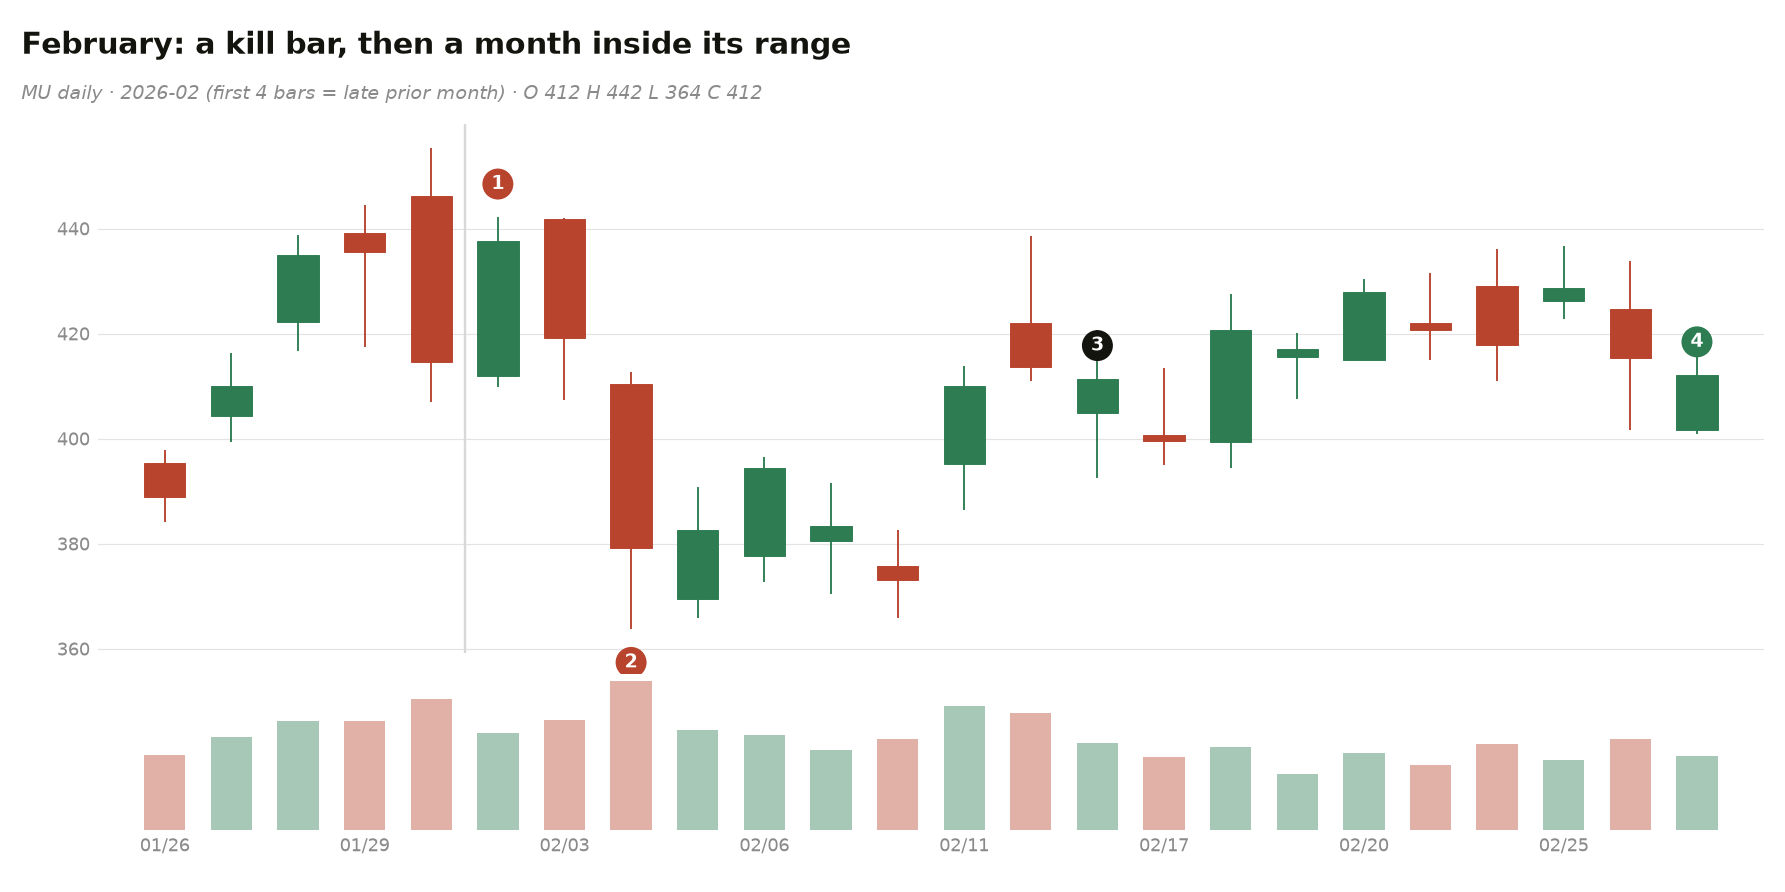
① Feb 2: one more push, 442 — it fails to take out Jan 30
② Feb 4: the kill bar, −7.6% on the month's heaviest volume — the advance is terminated
③④ the rest of the month trades INSIDE that bar's range: the kill bar becomes the mother bar (L2.5), and price repairs quietly back to its middle — a whole month coiled inside one bar, which is L3.1's quiet loading the spring, only this time the loading happens after a decline. Contained ≠ resolved.
March
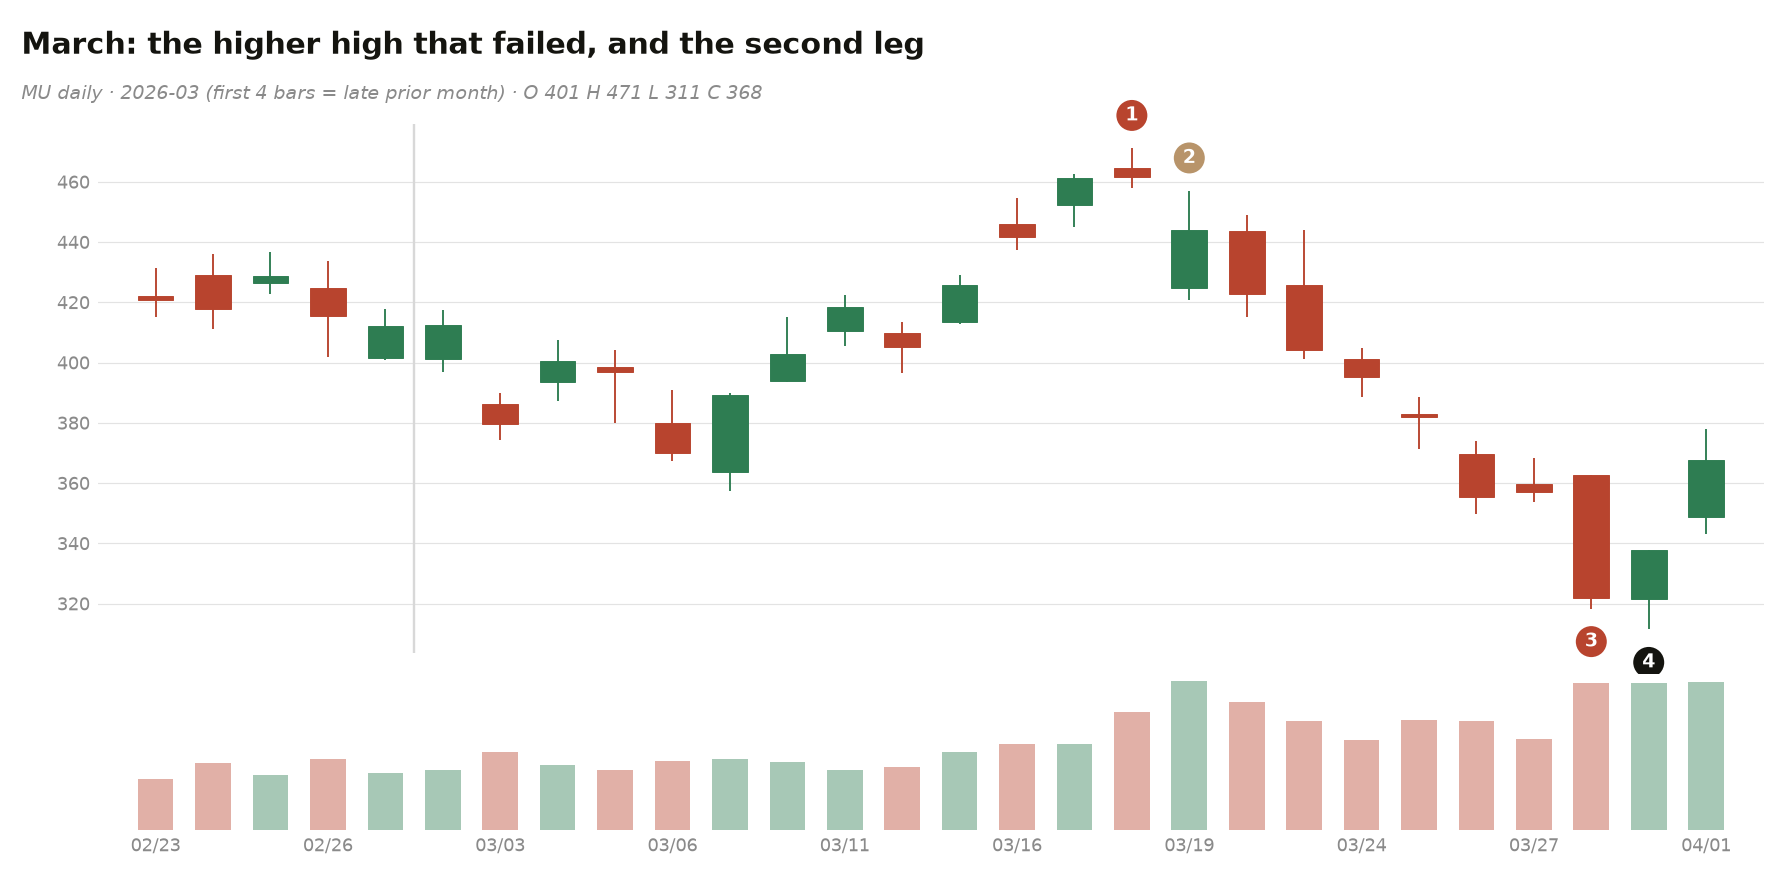
① Mar 18: a HIGHER high, 471 — 3.5% above January, textbook breakout bait, and February's spring letting go upward
② Mar 19: the move's biggest volume (2.0x)… and no follow-through — sky volume with nothing to show is the scream, not the start (L5.3)
③ Mar 30: −11.3%, the second leg lands (L3's trap-1, at monthly scale)
④ Mar 31: 311 — the whole three-month advance gone.
April
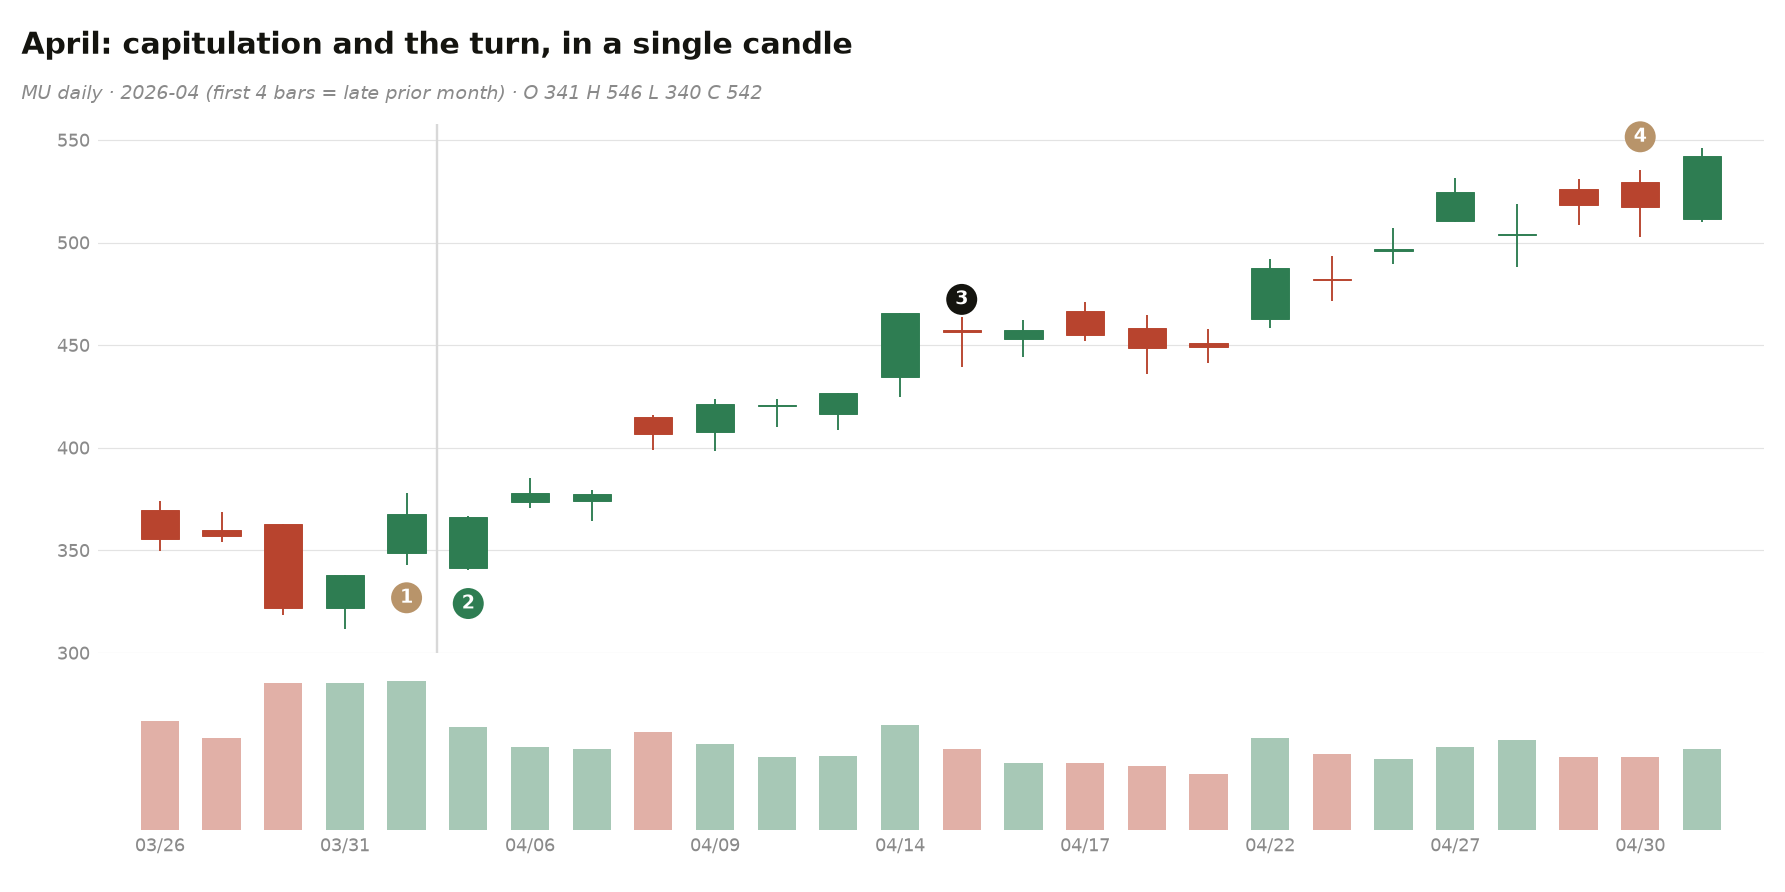
① Apr 1: the heaviest volume in weeks, on a green close — someone is CATCHING the panic
② Apr 2: the month's low, 340, and its biggest UP bar — the same candle: an undercut-and-rally compressed into one bar (L4)
③ mid-month: the March breakdown zone reclaimed — no reclaim, no bottom; this is the reclaim — the reclaim is the trigger, the undercut is the risk (L4.4)
④ Apr 30: 535, a new high. From capitulation to new highs in twenty sessions.
May
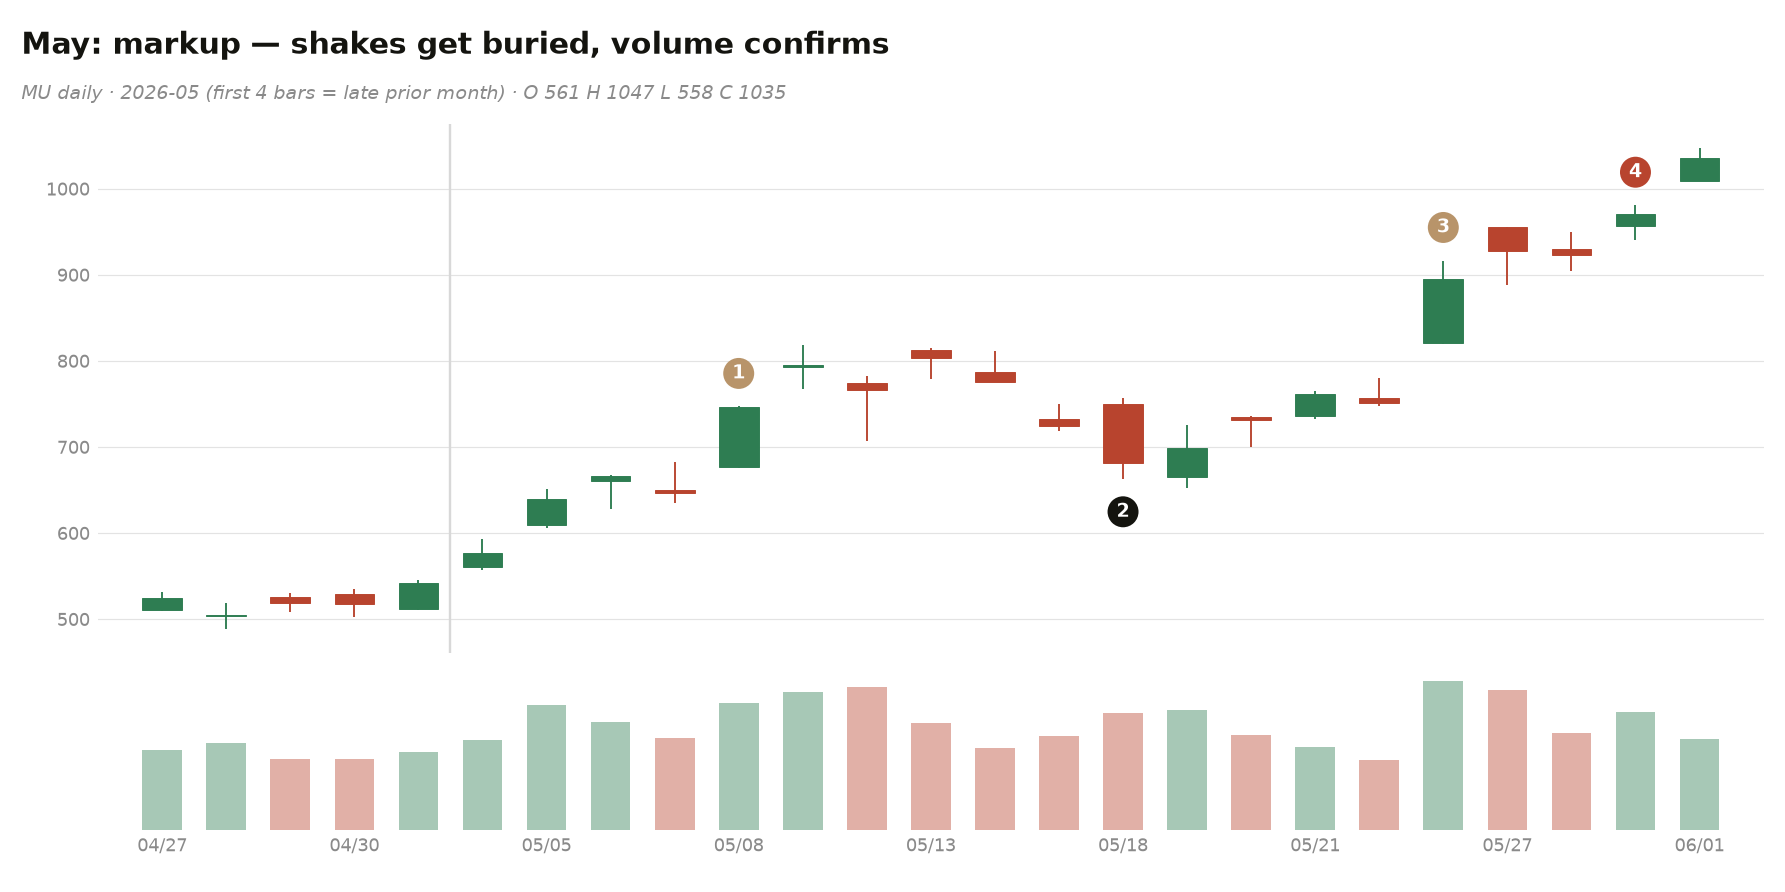
① May 8: +10.4% — the trend goes to a gallop
② May 18: −9.2%, a kill-bar shape in mid-trend — and it is buried within days: same shape, different address (L2.7, L3's trap-2)
③ May 26: +9.2% on expanding volume — fuel confirmed again
④ May 29: 981. This is markup: you ride it, you do not outsmart it.
June
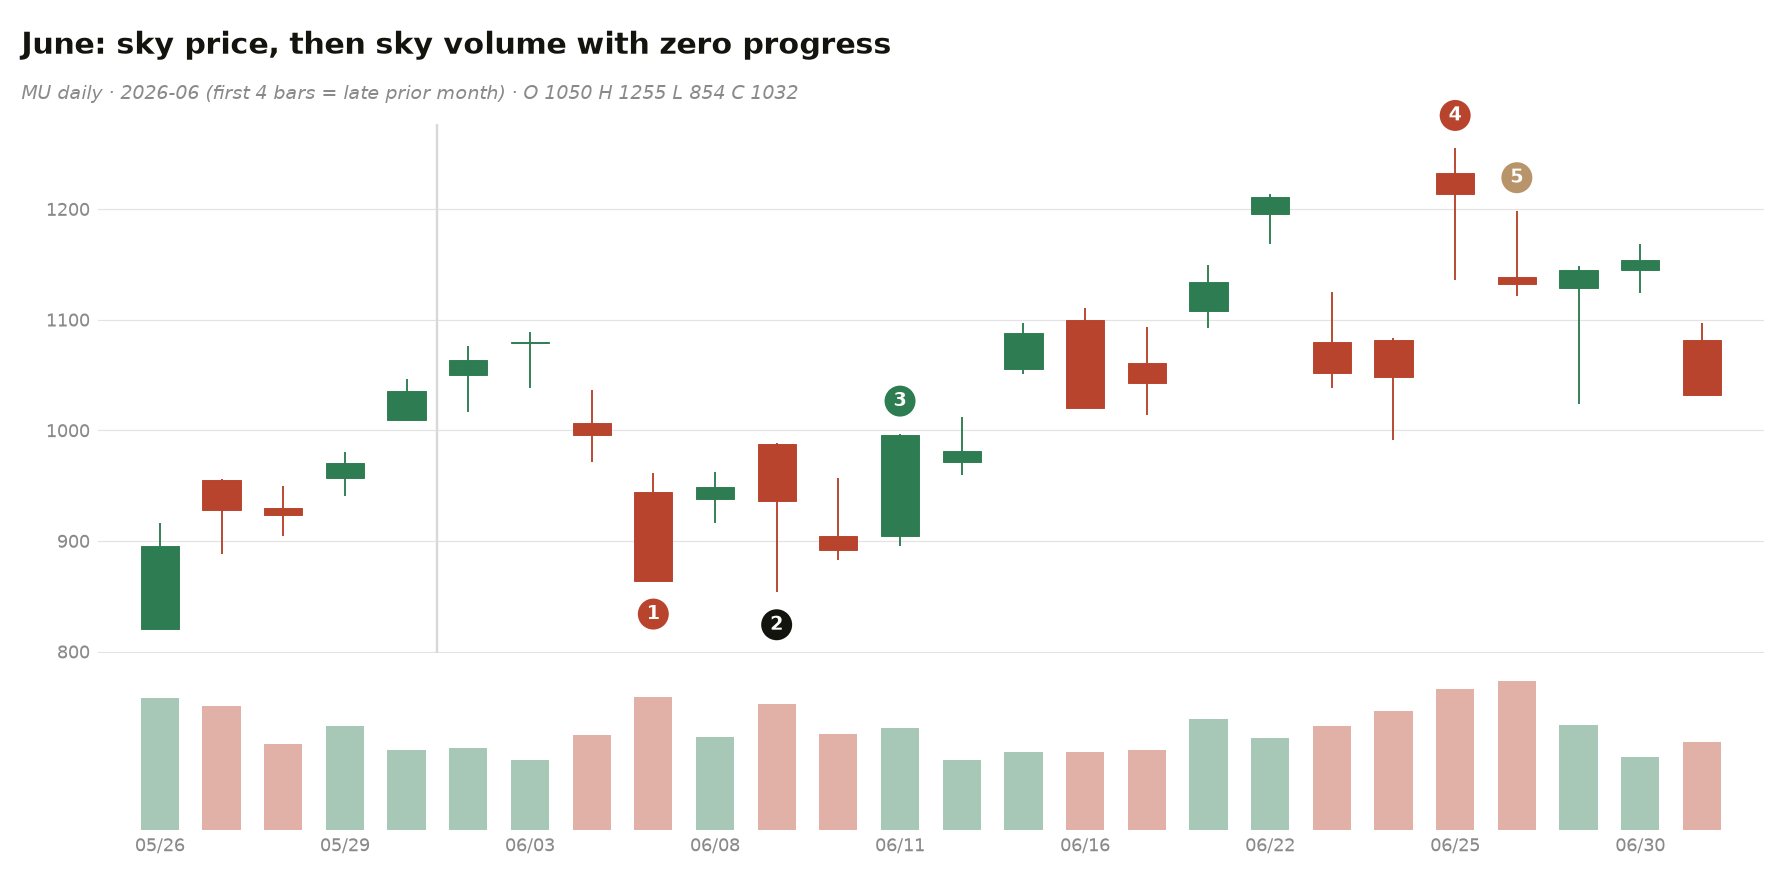
① Jun 5: −8.5% kill bar — first real aggression against the trend since February
② Jun 9: 854, the shake's low
③ Jun 11: +10.1% — buried again…
④ Jun 25: sky price, 1255
⑤ Jun 26: sky volume, zero progress (−0.6%) — the crowd's last full-throated scream, one day after the high. L5.3's climax anatomy, complete.
July
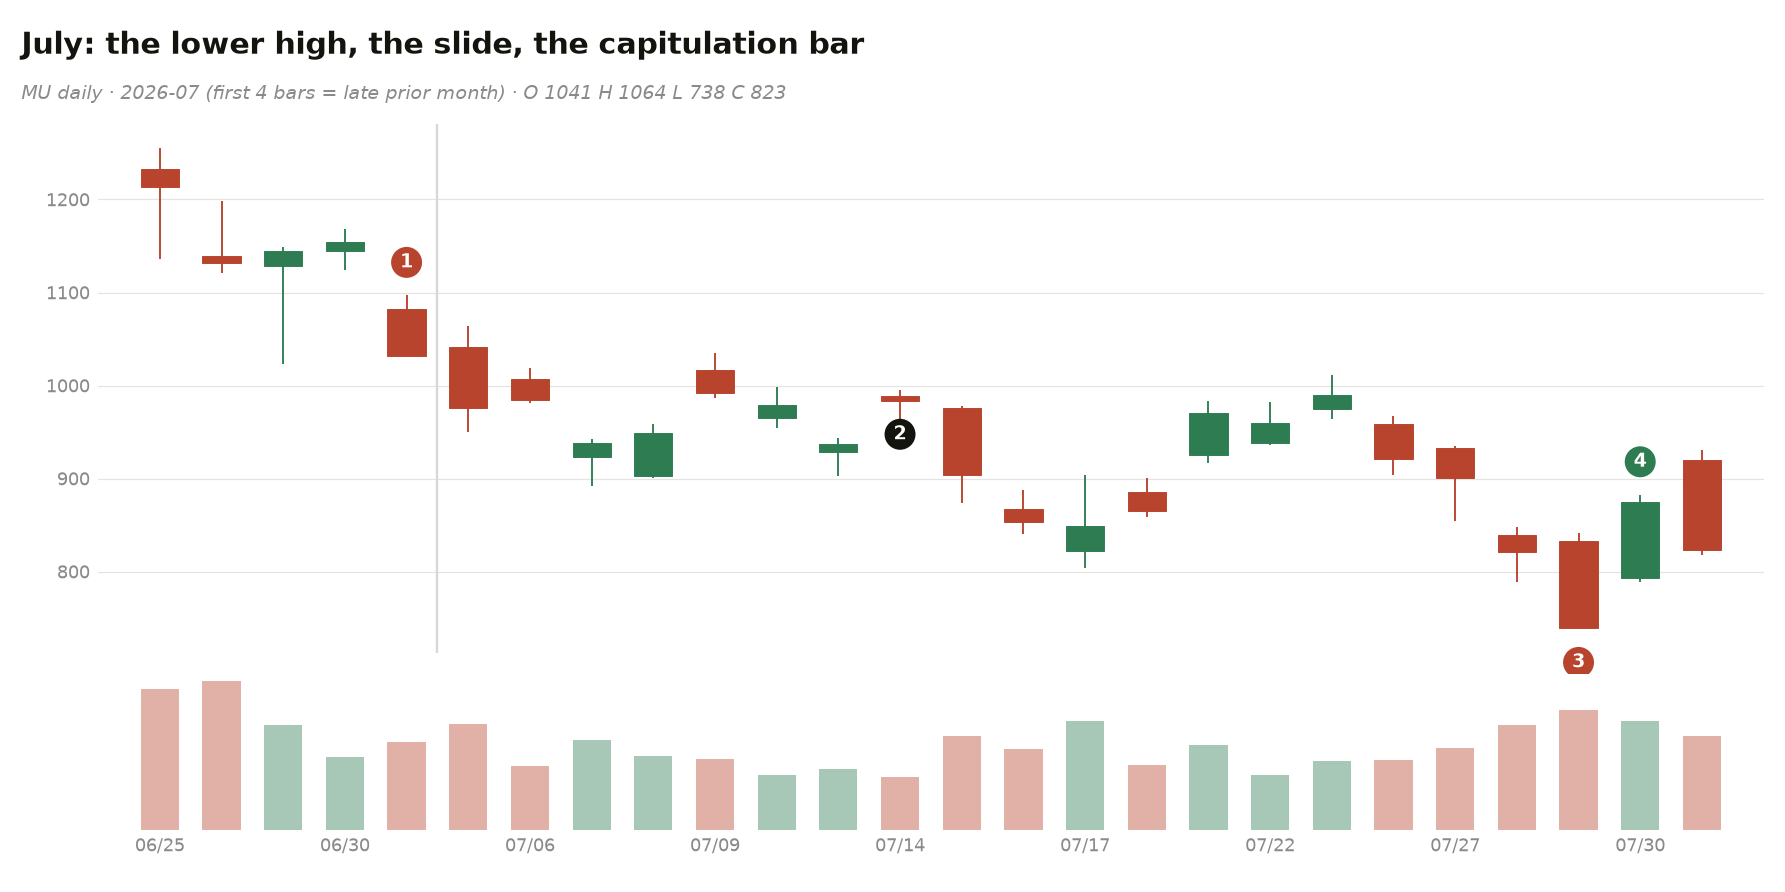
① Jul 1: 1097 — a LOWER high, 13% under June's peak: buyers thinned where they were loudest (TSLA's grammar, L5.3-②)
② mid-month: the June shake-low gives way — structure broken, no reclaim attempt succeeds
③ Jul 29: −11.3% on the month's heaviest volume, 738 — capitulation
④ Jul 30: +10.3% — the first candle of the NEXT story.
August
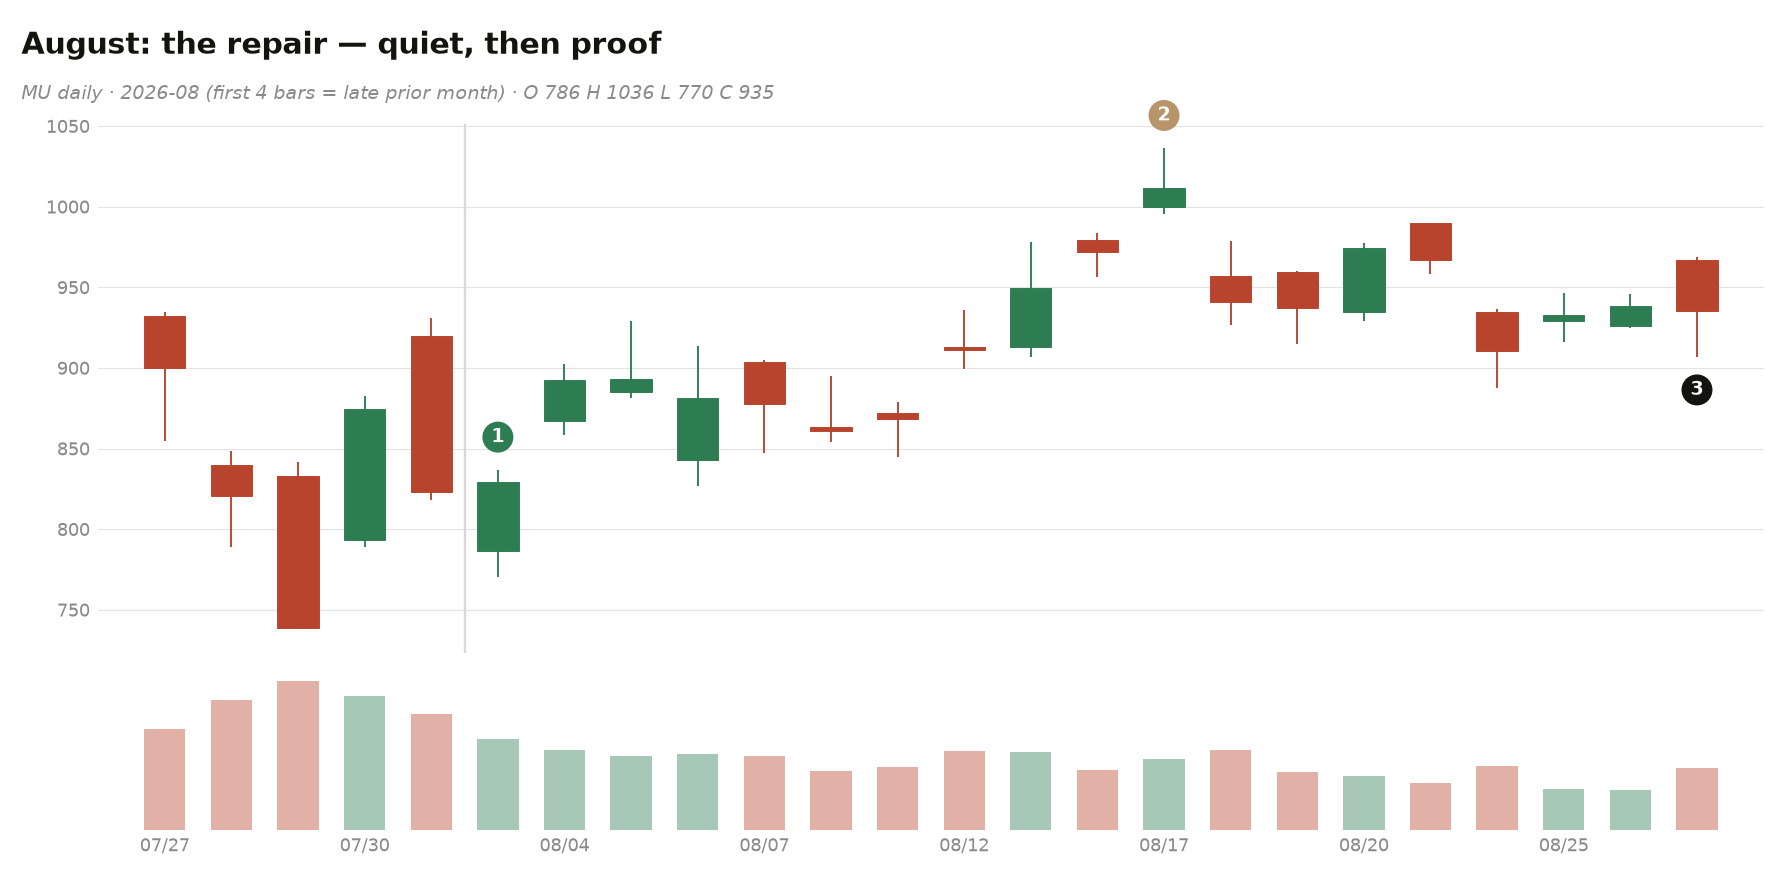
① Aug 3: the turn confirms on follow-through
② Aug 17: 1036 — the repair recovers most of July
③ month-end: quiet drift on shrinking volume — a base forming where there was panic (L5.2-③, in miniature). Eight months, one stock, and every tool in this module used at least once. That is the course.